

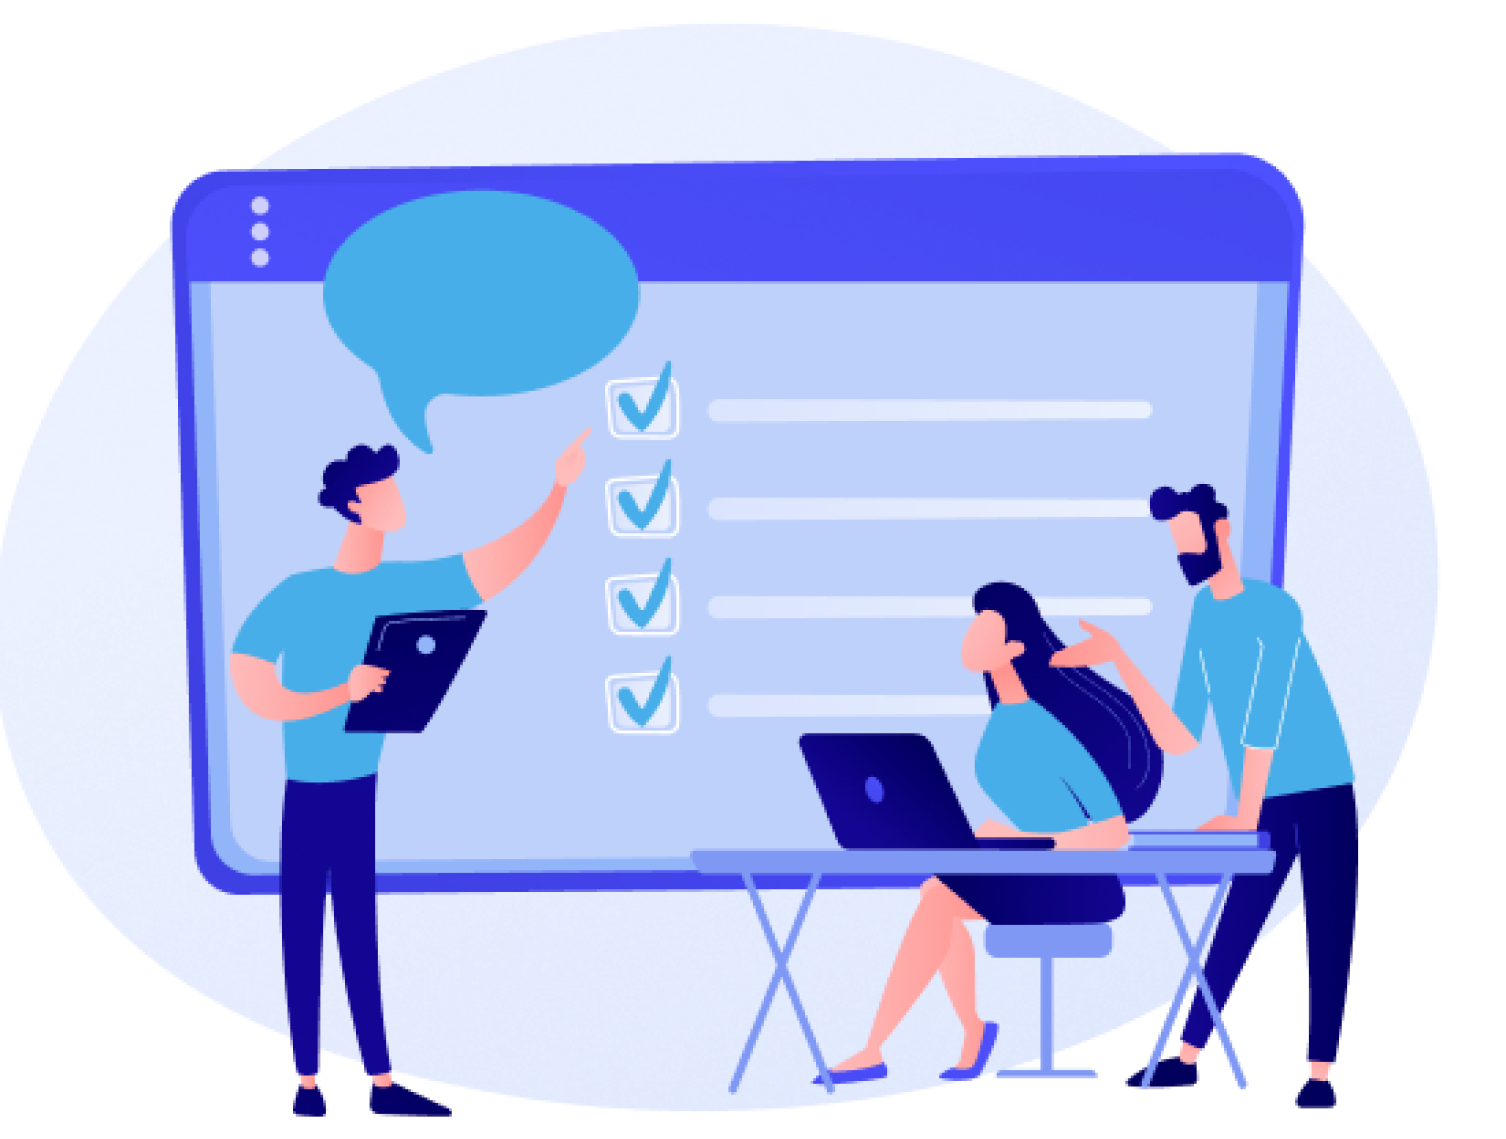
Document Classification
With such a big amount of textual data being produced every minute, it might be challenging for a company to handle it relying on human resources only.
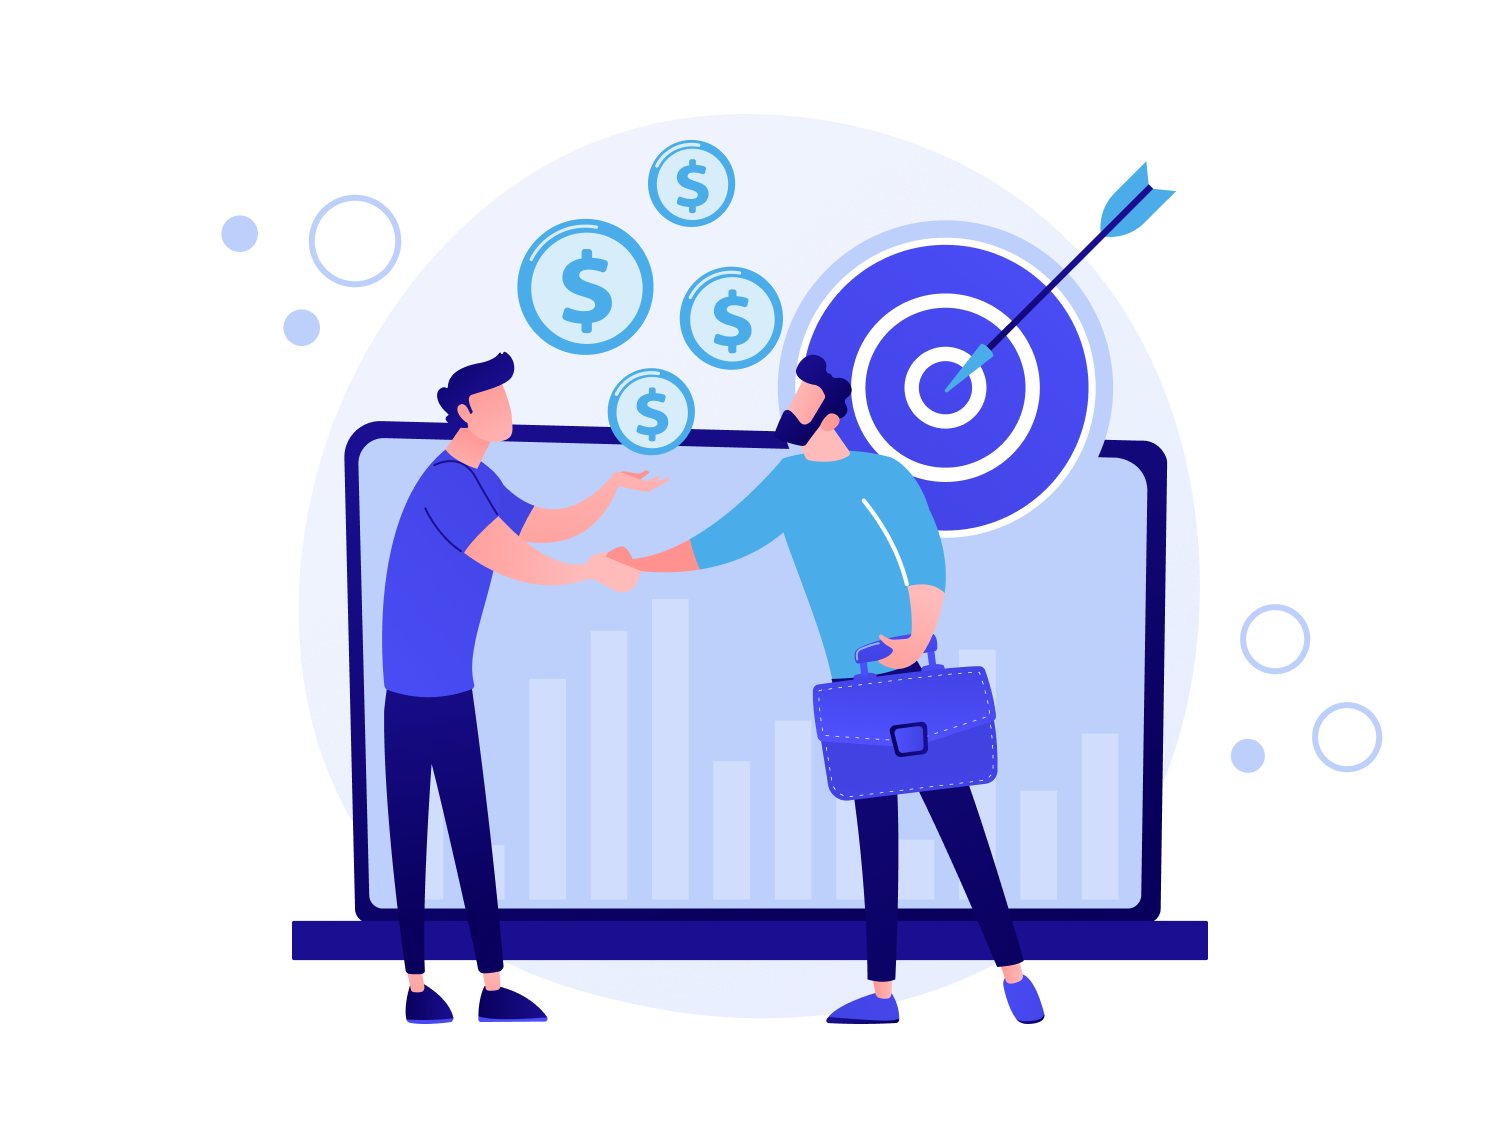
Contract Analytics
Contracts are the engine of any business. Inefficient contract management is the root of 70-75% of failing projects that may cost you up to 9% of annual revenue.
Recommendation engines
Keeping the customers coming back and engaging with your brand or platform, wanting more of your content or product is proven to be beneficial in many ways.

Social Listening
Social listening is a powerful tool that can help you get valuable insights for your business by tracking social media platforms.
Review analytics
Every day your potential customers look for online reviews to choose a product or service as it’s the most important factor to consider after the price.
Customer Service Analytics
Customer service analytics is the process of collecting and analyzing data that is generated from your customer service team
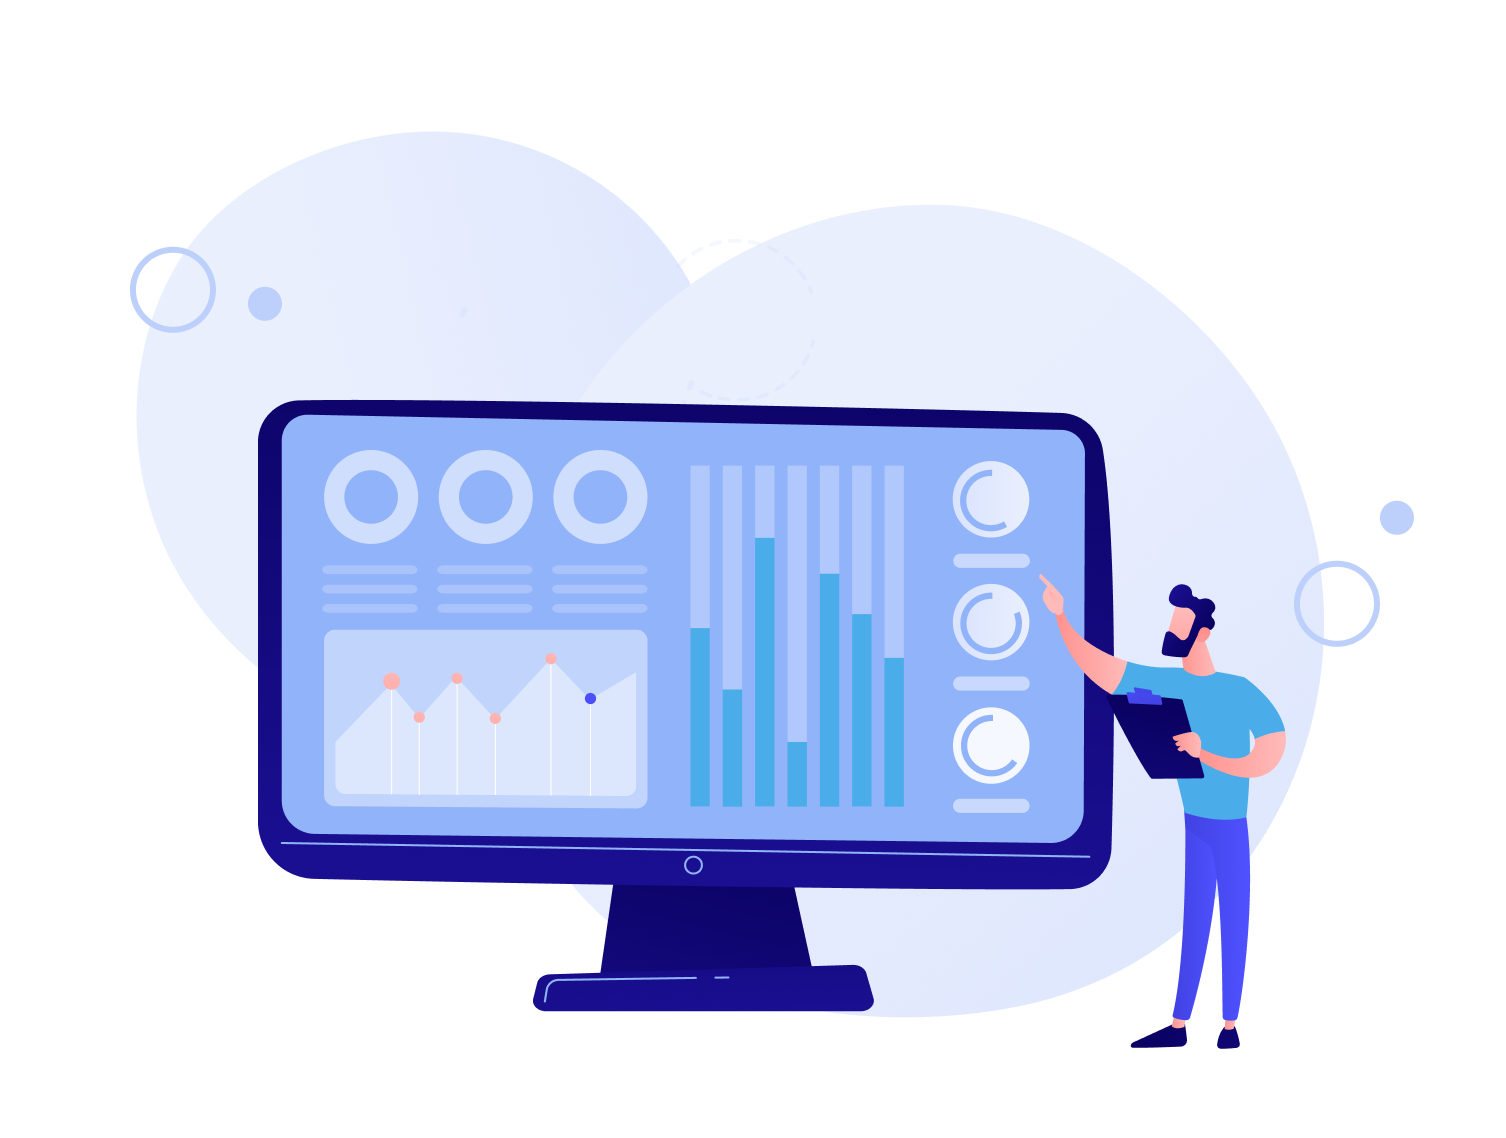
Dashboards
Businesses that use visualization capabilities get an up to 130% ROI more compared to ones that do not use them
Knowledge Graph Use Cases
The use of knowledge graphs is a point of inquiry for more than 50% of companies who are looking for artificial intelligence solutions.
Test Data Management
With high-quality, relevant, and accurate data you will be able to detect errors early at a lower cost and save resources for other stages of the process development.
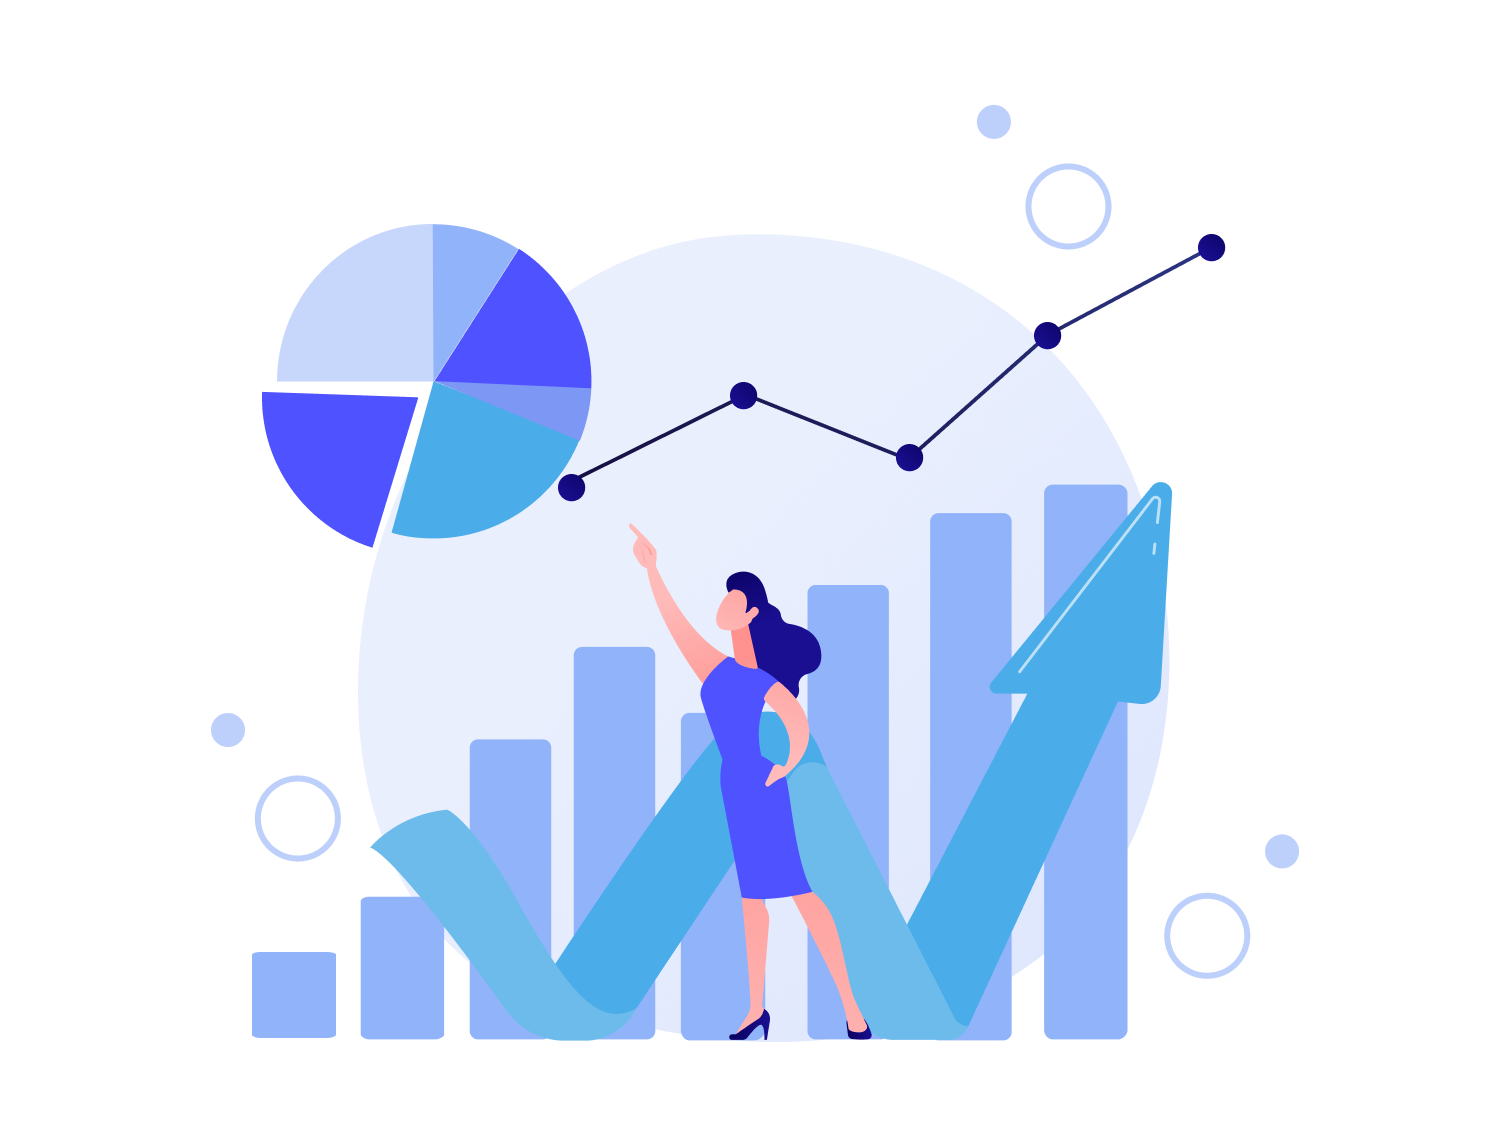
Funnel Analysis
Funnel analysis is a powerful analytics tool that helps see and track conversions on every stage of a customer journey.
Data Anonymization
Data anonymization is the process of protecting private or sensitive information from data sets. During the process, personally identifiable information is removed from data sets.
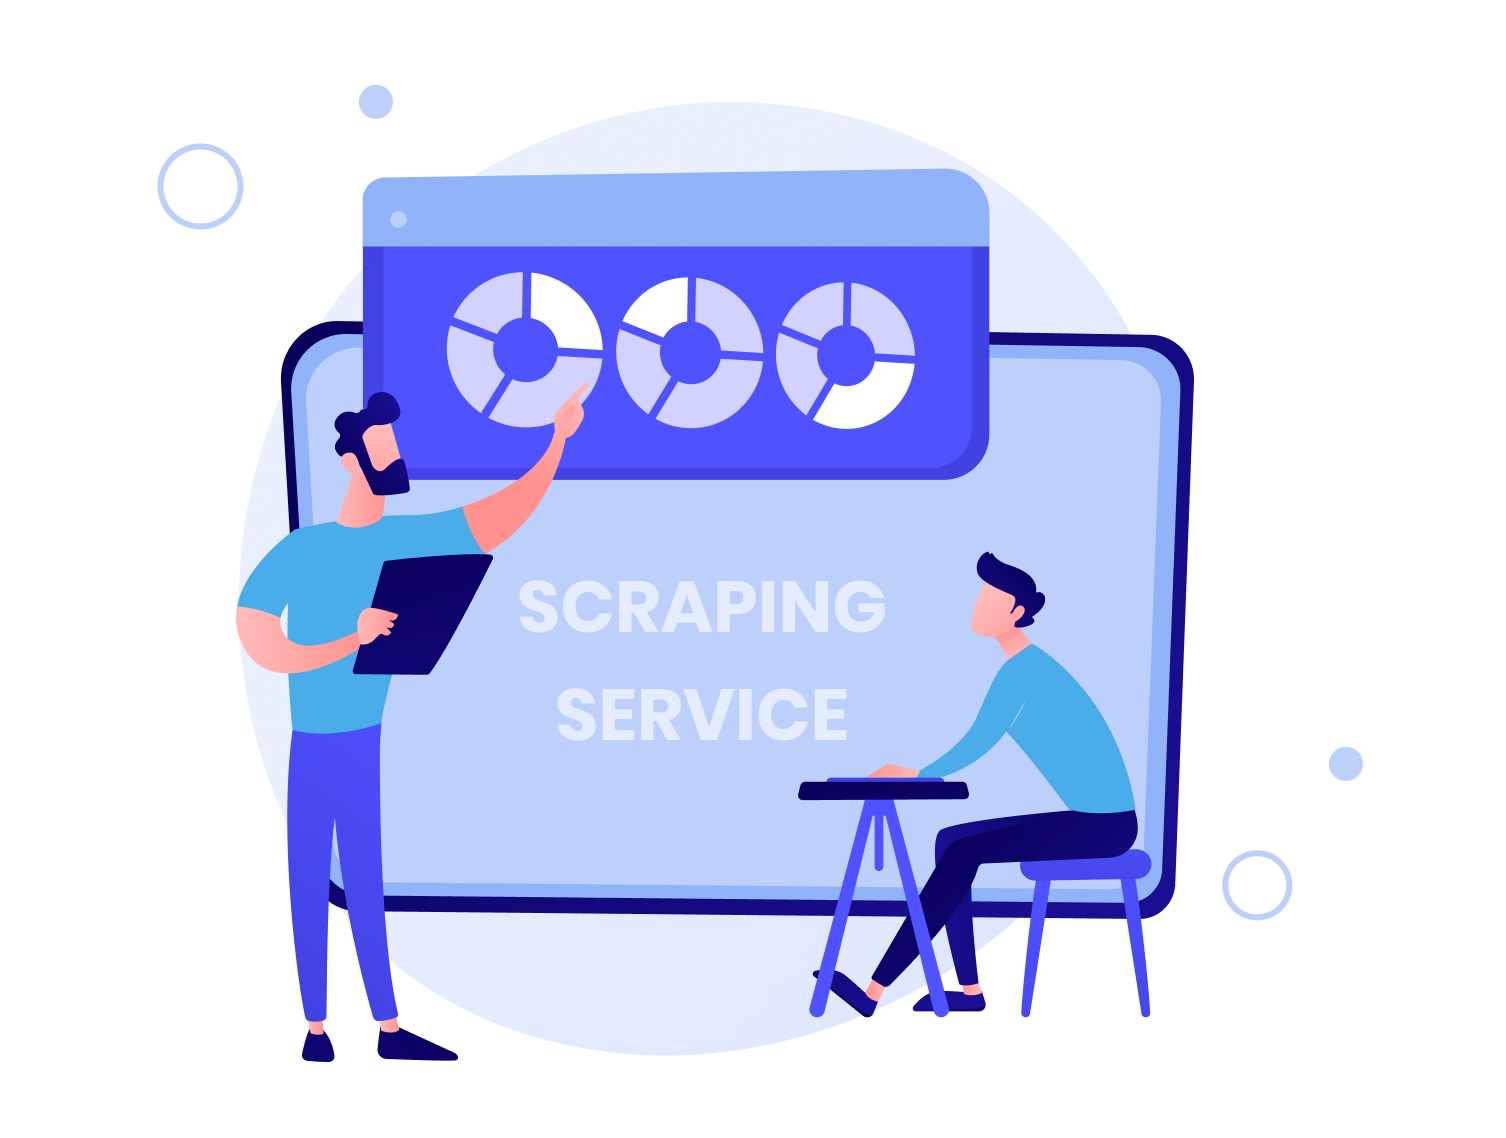
Data Scraping Service
Data scraping is a crucial part of data science that includes the extraction of publicly available information from a web page, application, database, reviews, tables or even audio source and importing it to your local storage.
Data Warehousing
With data warehousing, every business shifts its focus from manual processing of the data to strategic goals. Storing consistent, standardized and accessible information enables its seamless usage between different departments, and helps them make smarter metric-driven decisions.
Knime Services
At Redfield, we help customers get started on projects efficiently.
Social Listening
Social listening is a powerful tool that can help you get valuable insights for your business by tracking social media platforms.
Review analytics
Every day your potential customers look for online reviews to choose a product or service as it’s the most important factor to consider after the price.
Customer Service Analytics
Customer service analytics is the process of collecting and analyzing data that is generated from your customer service team
Test Data Management
With high-quality, relevant, and accurate data you will be able to detect errors early at a lower cost and save resources for other stages of the process development.
Data Anonymization
Data anonymization is the process of protecting private or sensitive information from data sets. During the process, personally identifiable information is removed from data sets.
Data Scraping Service
Data scraping is a crucial part of data science that includes the extraction of publicly available information from a web page, application, database, reviews, tables or even audio source and importing it to your local storage.
Dashboards
Businesses that use visualization capabilities get an up to 130% ROI more compared to ones that do not use them
Knowledge Graph Use Cases
The use of knowledge graphs is a point of inquiry for more than 50% of companies who are looking for artificial intelligence solutions.
Funnel Analysis
Funnel analysis is a powerful analytics tool that helps see and track conversions on every stage of a customer journey.
Dashboards
Businesses that use visualization capabilities get an up to 130% ROI more compared to ones that do not use them
Data Warehousing
With data warehousing, every business shifts its focus from manual processing of the data to strategic goals. Storing consistent, standardized and accessible information enables its seamless usage between different departments, and helps them make smarter metric-driven decisions.
Document Classification
With such a big amount of textual data being produced every minute, it might be challenging for a company to handle it relying on human resources only.
Contract Analytics
Contracts are the engine of any business. Inefficient contract management is the root of 70-75% of failing projects that may cost you up to 9% of annual revenue.
Recommendation engines
Keeping the customers coming back and engaging with your brand or platform, wanting more of your content or product is proven to be beneficial in many ways.