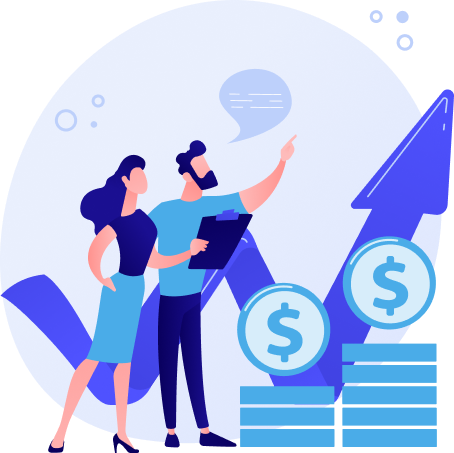
Graph embeddings and solutions have gained momentum due to their wide-ranging applications across multiple industries. Gartner predicts that knowledge graphs will be a part of 80% of data and analytics innovations by 2025, up from 10% in 2021. Several factors are driving the adoption of graph technologies. Specifically, the ever growing amount of data being generated and collected, and the necessity to cohere it and make it serviceable for various purposes, has led to the use of artificial intelligence (AI) and machine learning.
In AI, enterprise knowledge graphs complement machine learning techniques to make more accurate predictions and reduce the need for extensive and labeled datasets. Additionally, enterprise knowledge graphs organize, integrate data and provide context to structured data. Companies use knowledge graphs to understand their customers, improve business processes and make the decision making process straightforward.
Knowledge graphs co-exist and complement data-driven solutions, including natural language processing (including text understanding, knowledge extraction, text generation, language detection, and identification of semantic relationships) and data management (collecting, processing, validating, and storing data, data integration of different data types. Additionally, the data comes from disparate sources, meaning the data can be structured and unstructured, which requires ensuring high data availability and disaster recovery).
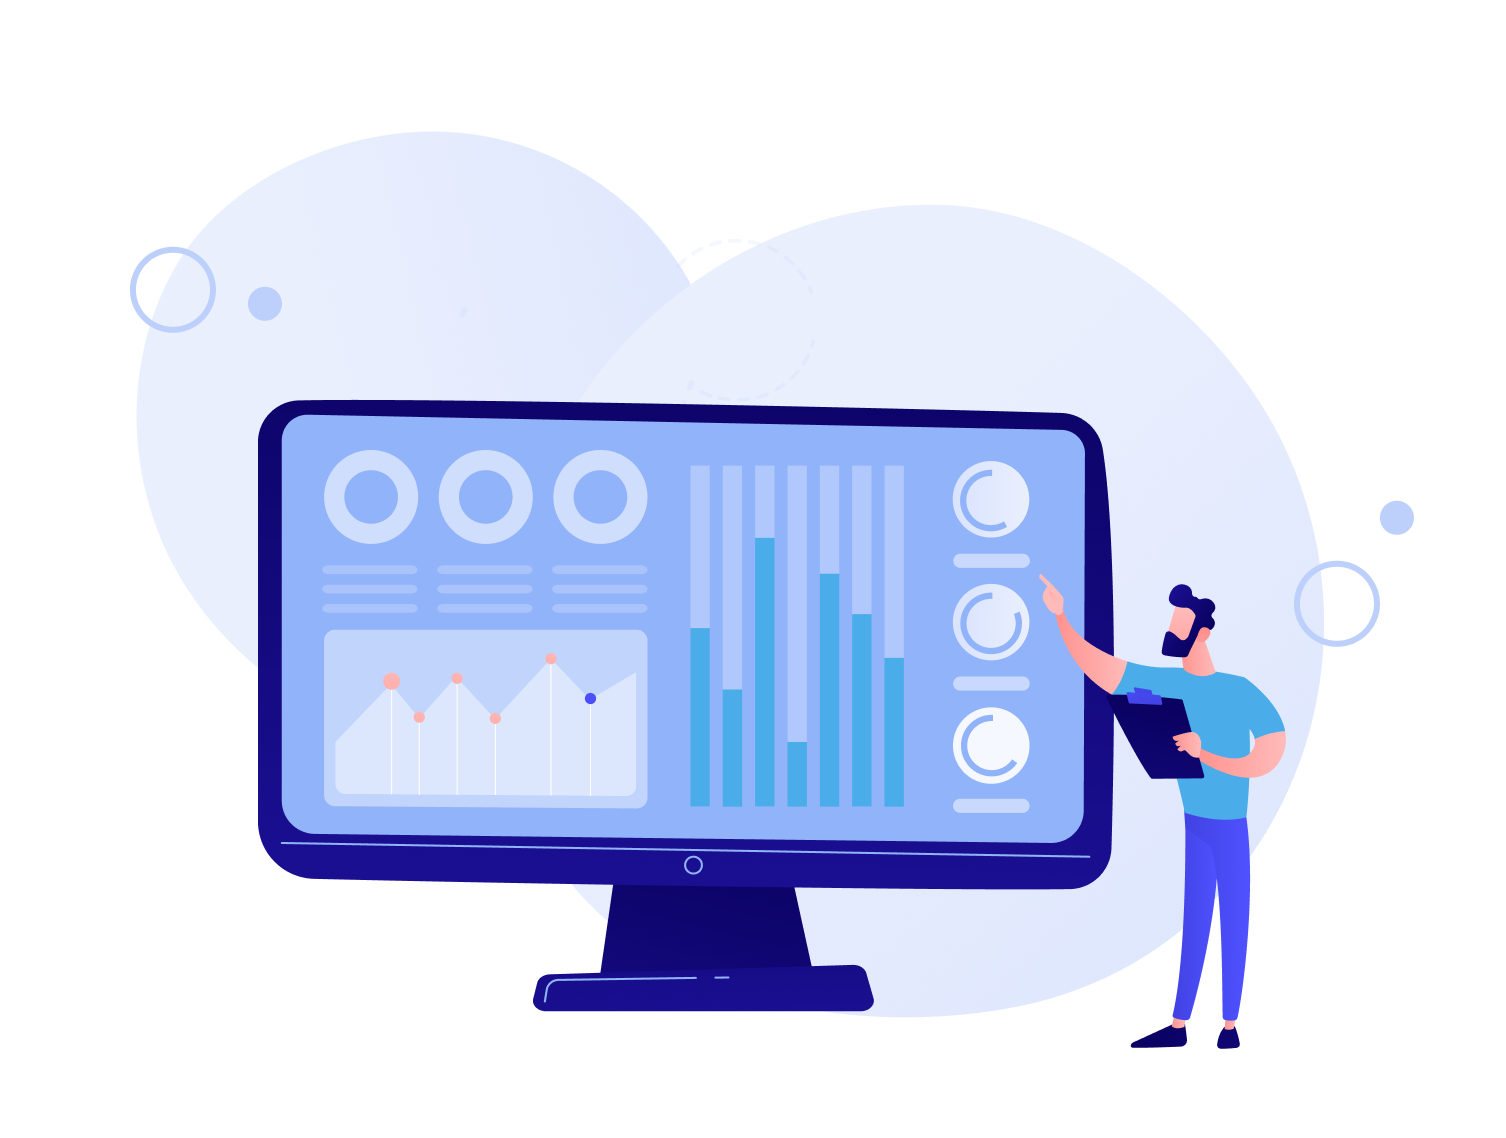
Graph analytics is a new field of data science and computer science that helps organizations leverage their model by adopting a variety of algorithms to identify the best solutions for their challenges. This emerging data analysis form helps businesses understand the complex relationships between linked data and entity data in a network or graph. Each algorithm analyzes the connections uniquely, revealing new information. Streaming visualizations give continuous information regarding patterns and examples, enabling users to respond promptly with data driven decisions.
For many organizations, however, the question remains: “Is it the right solution for us?”
What Is a Knowledge Graph?
A knowledge graph, also known as a semantic network, portrays the relationship between real world entities, such as objects, events, situations, or abstract concepts. The knowledge graph provides a unified view of the organized entities of interest in a given domain or task by organizing data from multiple sources.
In data science, knowledge graphs facilitate access to data preparation and integration of data sources, add context to data driven AI technologies, including machine learning, and bind together users, scientists and engineers, data models, and intelligent systems.
Graph data stores effective models and explore and query data with complex interrelationships across data silos but are limited due to the lack of specialized skills. The no-code tool: knowledge graphs transform data management by representing qualitative and quantitative facts about the objects described and allowing users and machines to infer those facts to draw new factual conclusions.
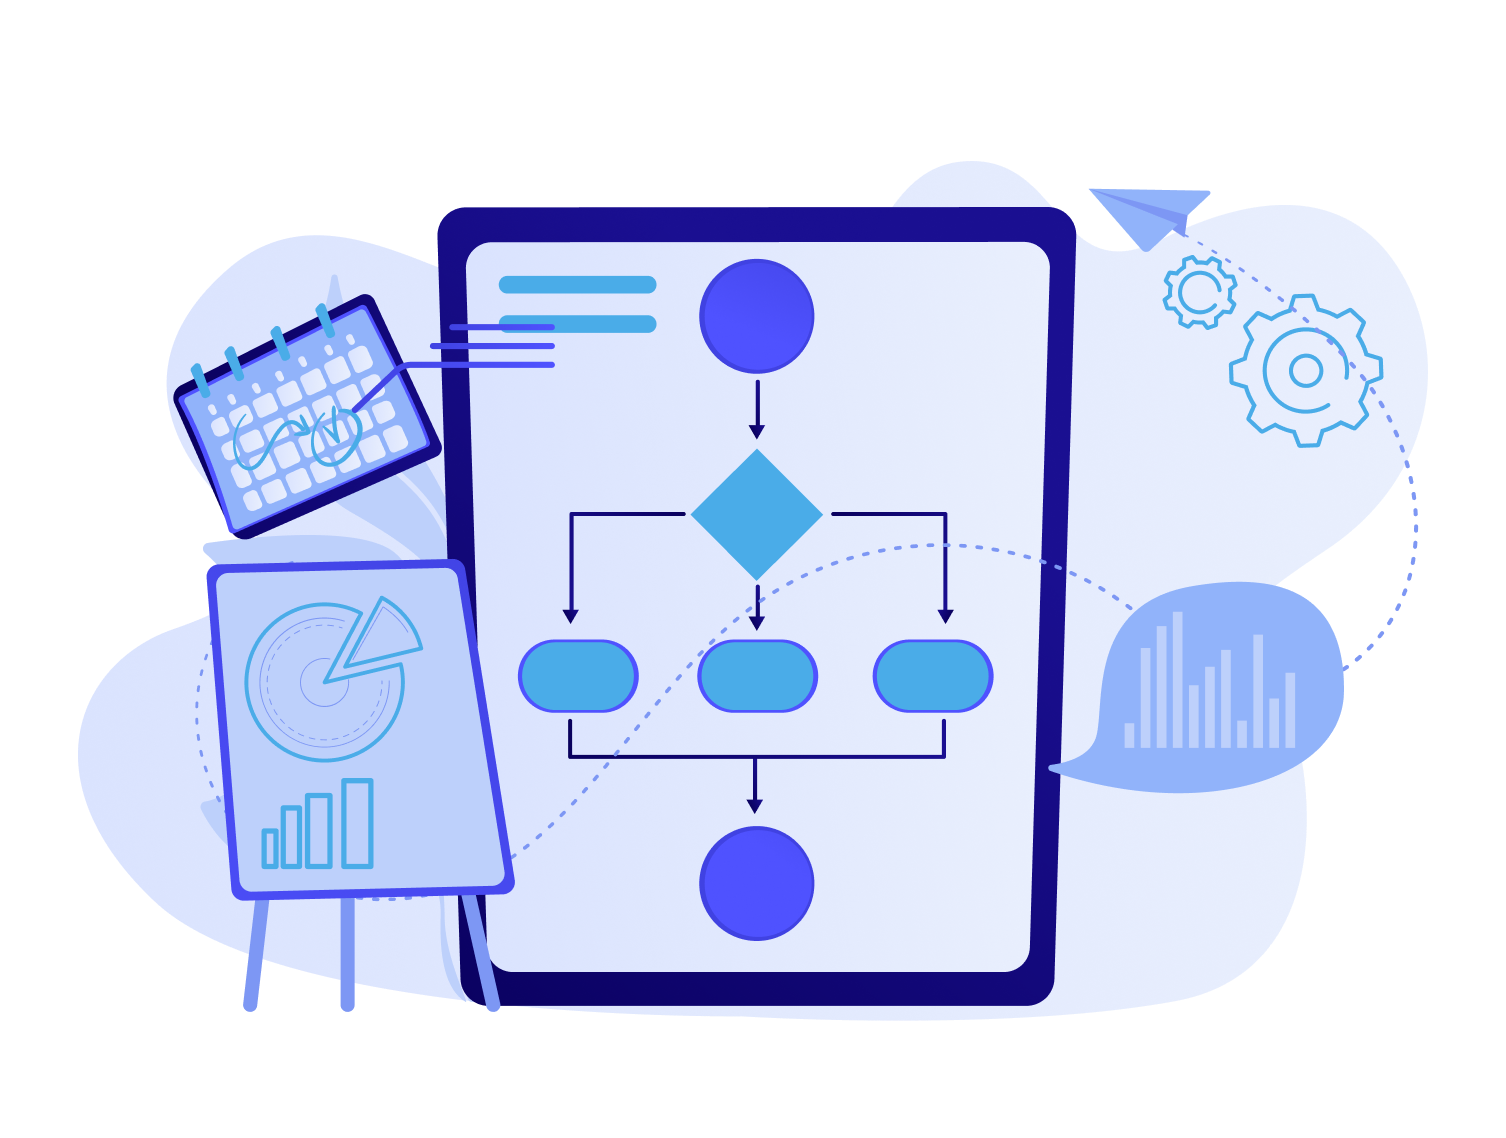
How Does a Knowledge Graph Work?
The relationships between objects shown in the knowledge graphs, their nature, and what those relationships might implicate are digitally presented in knowledge graphs. This enables businesses and organizations to make sense of the vast quantities of diverse and complicated information contained in complex data.
The digital representation of the network of real world entities in the knowledge graphs is the foundation of search engines or question answering services. The process of serving useful data with great precision and speed requires searching for and finding relationships between the information available in the data silos.
Knowledge graphs have been incorporated into our daily lives for over a decade, whether through search results such as Google knowledge graphs, voice assistants (such as Alexa, Siri, and Google Assistant), or personalized shopping experiences through online recommender systems. A great deal of organizations is already using knowledge graph technology to boost their power and stay ahead of the game, with the help of knowledge graphs and graph databases used by all types of industries, ranging from banking, health and pharmaceutical, auto industry, oil and gas, retail, publishing, media and more.
Although these companies vary in size, structure, strategy, policies, procedures, culture, the technology they use, the end product, the data lineage, market intelligence company’s specific vision or mission, their approach, and the intangible elements, the end game is the same: taking large amounts of data from various data silos and adding value to it so that it can be used in a meaningful and intelligent way.
The development of artificial intelligence and natural language processing has led to a new era of search engine optimization known as semantic search producing semantic representations.
Why Are Knowledge Graphs Important?
The heart of the enterprise knowledge graph is a knowledge model: a collection of interlinked descriptions of concepts, entities, relationships, and events. Knowledge graphs put data in context by linking it and putting the semantic metadata into a framework for data integration, unification, analytics, and sharing. In the Google knowledge graph model, the descriptions have formal semantics that allows humans and computers to process them effectively and unambiguously. The network formed from descriptions has entities that represent part of the descriptions of the entities related to it. According to the enterprise knowledge graph model, the diverse data is connected and described with semantic metadata, which enables the incorporation of world knowledge.
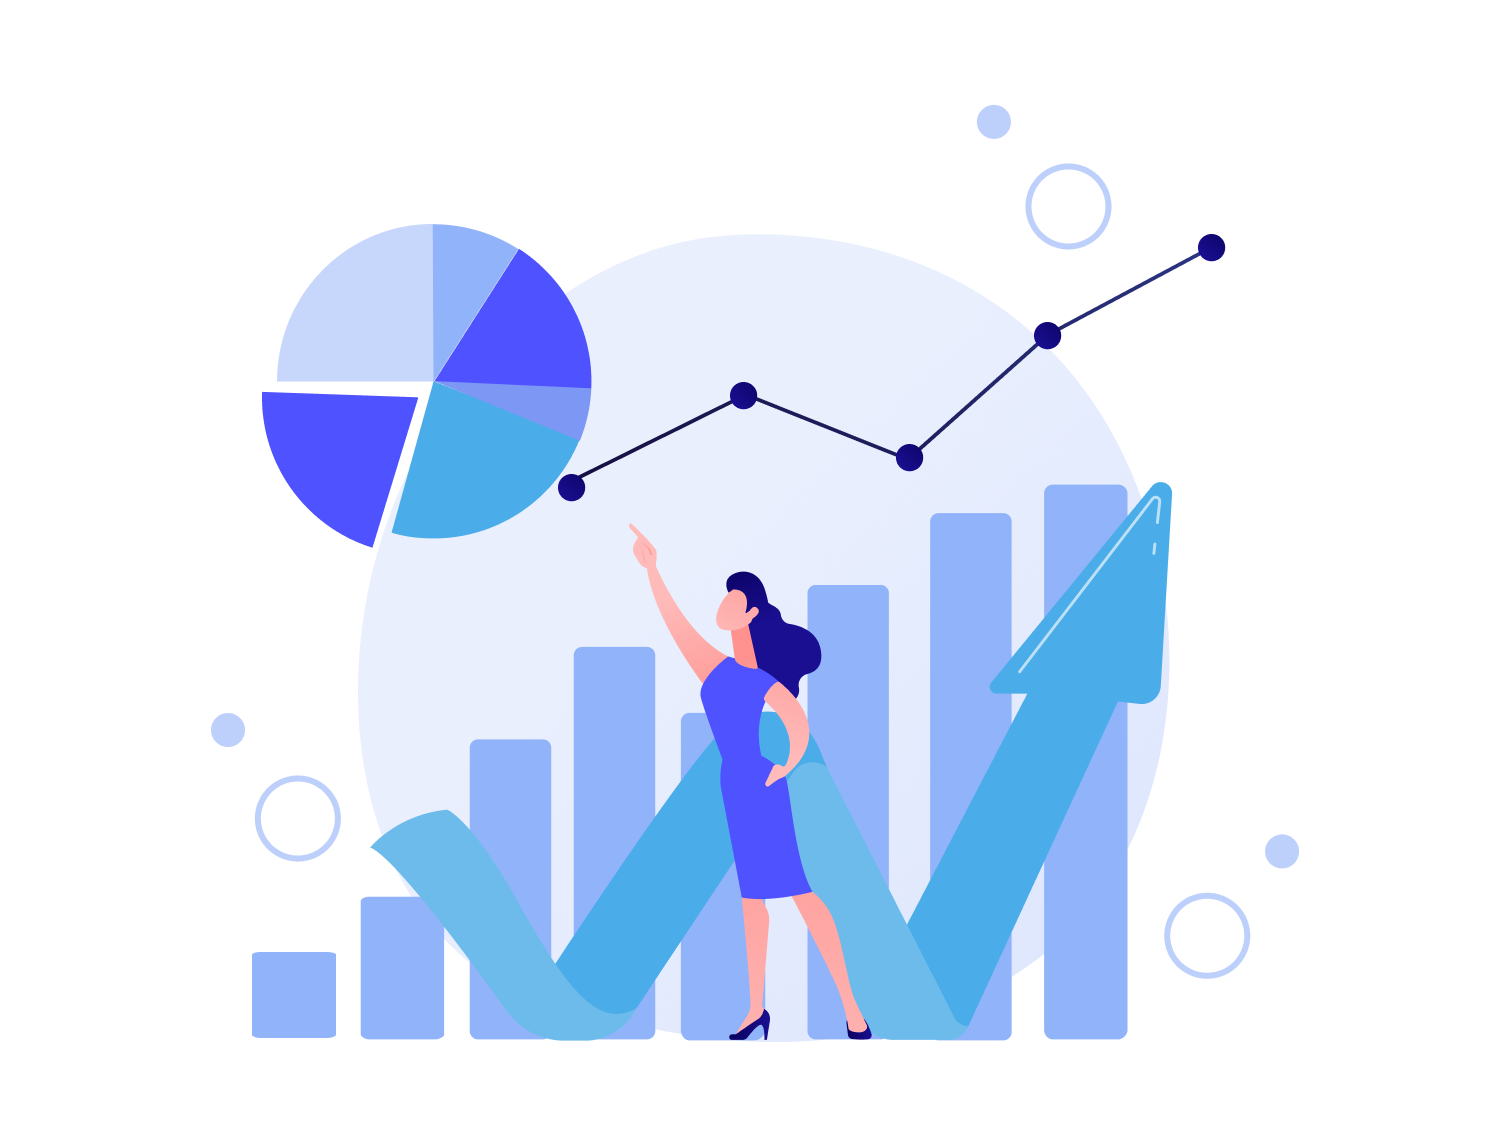
Knowledge graphs have great features, and their ability to highlight the most complex relationships between data entities, visually represent them by creating much-needed context, and ultimately help businesses to inform decision making processes are just a few of them.
Knowledge graphs are a ground-breaking development that revolutionized the power of extracting valuable and insightful information from the immense amount of data generated and collected daily. The introduction knowledge graphs are a gold mine of predictive and actionable insights for large technology companies, public-sector organizations, financial institutions, solutions providers, healthcare, and more. The first knowledge graph was put forward by Google in 2012, called Google Knowledge Graph, followed by DBpedia, Freebase, Facebook’s entity graph, Wikidata, WordNet, and many more.
The knowledge graphs are a network of facts connected via explicitly defined relationships or underlying schema (ontology), which organize entities within the network and enable new knowledge to be inferred. They aid in data governance, fraud detection, knowledge management, search, chatbot, recommendation, and intelligent systems across multiple organizational units.
Knowledge Graph Use Cases
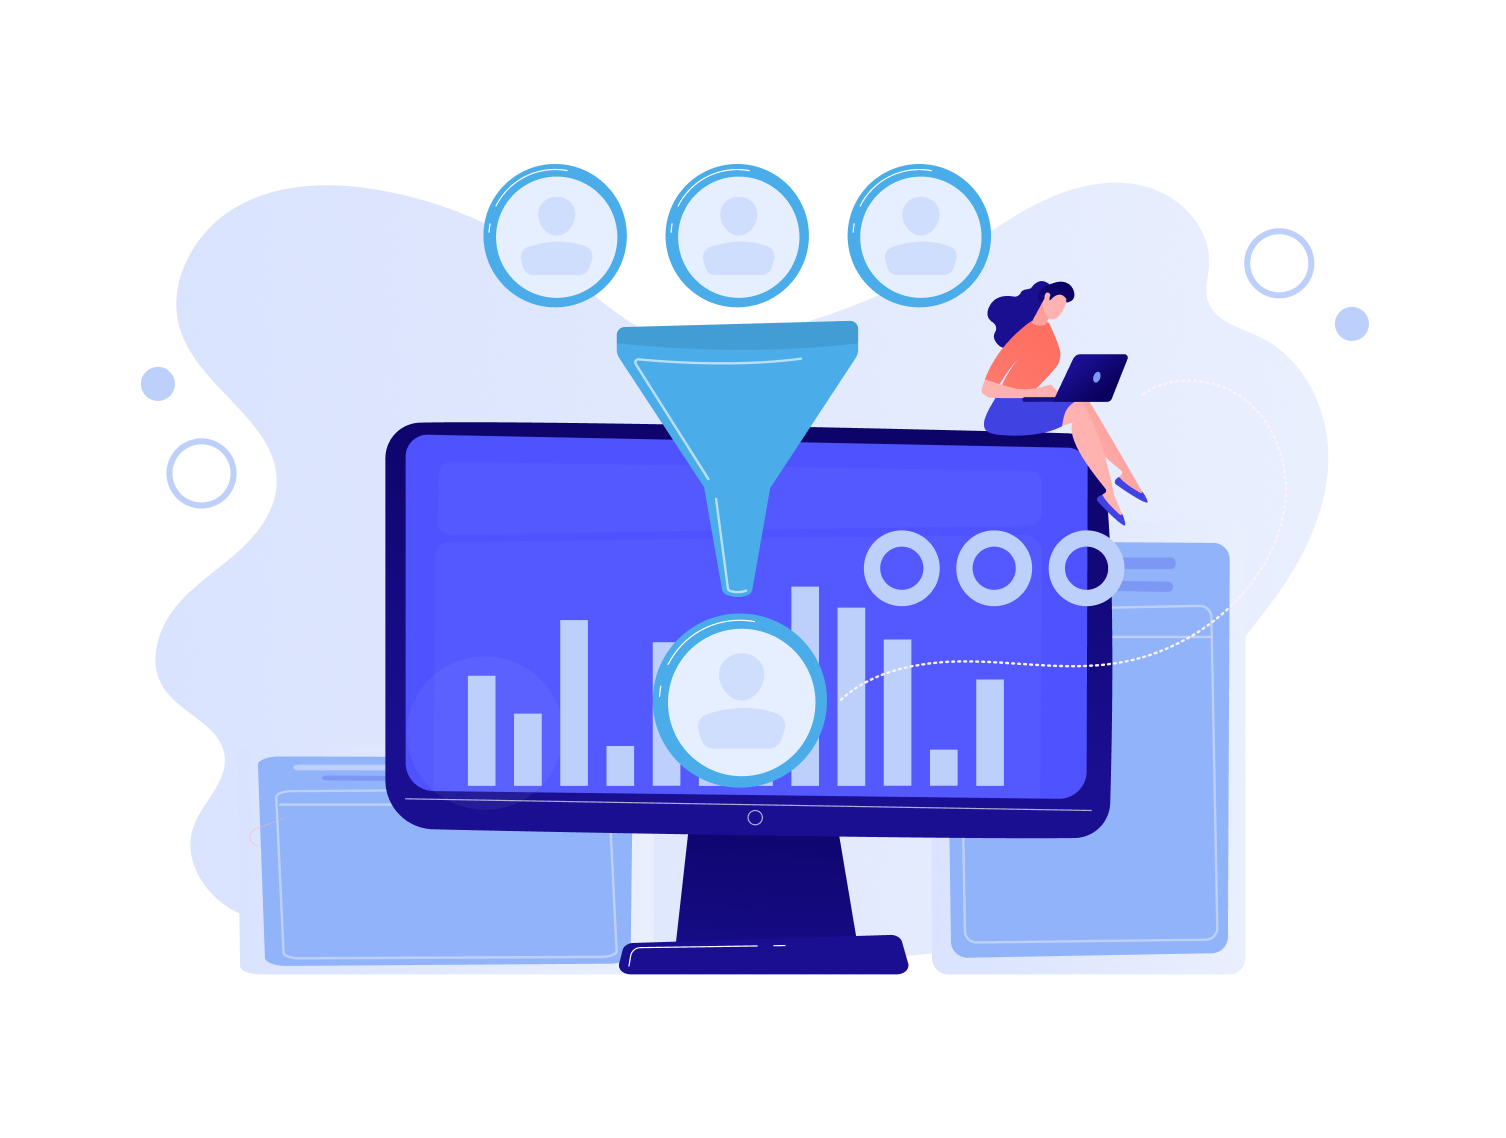
Use Case #1: Customer 360 / Enterprise 360
Customer data is typically spread across multiple enterprise applications, relational databases, servers, data teams, departments, states, and internationally. Each team and system within the organization oversees diverse data sets for customers to provide siloed experiences.
Graph database enables employees to create a connection layer that supports consistent collection and ingesting of information from internal and external sources, including different data types. Ultimately, graphs boost knowledge discovery, enable data-driven analytics to understand the company’s and customers’ relationship, and personalize the products and services.
Use Case #2: Supply Chain and Environmental Social Governance (ESG)
Companies must have a framework for their business practices and performance on various sustainability and ethical issues, so the plan for ESG is no longer an option. Many organizations have documentation and files on environmental impacts associated with their supply chain processes stored within department documents, relational databases, applications, or even in disparate locations.
With the help of graph analytics, organizations can establish a standardized, central platform to get insights. Additionally, knowledge graphs aid in the creation of standardized vocabulary across different industries with enables consistent understanding of the vocabulary and concepts used across the supply chain and various sectors. Graphs adapt data from diverse sources to support interactive queries and visually represent the elements.
Use Case #3: Financial Risk Detection and Prediction
The financial industry comprises a network of markets and transactions containing sensitive and personal information. There is a high risk of domino for the entire financial sector if one financial institution faces leakage, which is why most large organizations are determined to move their data to a data lake or a data warehouse. While these solutions offer users a method to understand and manage financial risk in one place, they need more scalability to know how data is interrelated.
With graph analytics, financial institutions can model and visualize the connections via the collection of nodes and points that specify the exact relationship between certain financial concepts and entities. Graph databases leverage the relationships among the entities and data fabric to enable the creation of semantically enhanced machine and deep learning and models of financial crimes.
Use Case #4: Mergers and Acquisitions
Mergers and acquisitions (M&A) success is directly linked to data/content and depends on many factors. Moreover, the integration inevitably brings an entire ecosystem of applications and operations. The merging or acquiring of new companies, including data governance, knowledge transfer, and strategic alignment, is another challenge in addition to the delicate success of M&As.
Knowledge graphs represent the data relationships, semantically harmonize, store, and connect similar and related concepts within the organization. Furthermore, graph analytics enables the presentation of information in how people speak, meaning there are taxonomies and schemas that allow data storage with organizational context.
Use Case #5: Data as a Product (And Data Interoperability)
Regarding enterprise data integration, the objective is to create relationships that facilitate flexibility and enable data to move between current and future systems, minimize limitations of its use, ensure proprietary solutions, and avoid vendor lock. In order to accomplish that, enterprise data also needs to have shared terminology such as data mine, web standards, and security protocols.
A great example of a conceptual graph model that offers common vocabulary and meaning of the key concepts and terms is the Financial Industry Business Ontology (FIBO) from the EDM Council. The end goal is to harmonize data, notwithstanding its source. Graphs are standard based on data models that consistently ingest diverse information from internal and external data sources (such as Linked Data, subscriptions, and purchases).
Use Case #6: Semantic Search
Organizations that solely leverage keywords to determine the search results face the sentiment “Search doesn’t work.” The core of the semantic search is to provide results based on context and meaning. The ability of the search engine to provide relevant search results to user intent depends on semantic understanding.
For this purpose, the knowledge graphs create a machine readable structure that integrates data and knowledge base, enables the systems to explicitly query data, and captures context so that the search engines can ‘understand’ the concepts, entities, and relationships between them.
The search engines such as Google, Amazon, and Booking leverage multiple knowledge graphs, in addition to natural language processing and machine learning to surpass basic keyword-based searching. Semantic search is becoming the fundamental feature of providing an excellent search experience.
Use Case #8: Targeted News Feed in Social Media
Knowledge graphs have a wide array of applications in the social media world. Facebook’s social graph today comprises over 1 billion monthly active users, 600 million of whom log in daily. The graph maps the users and their social connections, and these relevant data connections are used to derive insights into preferences. Ultimately, the graph derives targeted content from the user’s news feeds.
With graph analytics, model abstract logical statements and schemes are created, then filled with specific objects in the real world. The semi-structured model, graph flexibility, and the powerful logical apparatus enable graphs to enable machines to reason and infer new knowledge that is not previously described in the graph.
Use Case #9: Resource Management
The end goal of resource management graph algorithms is to optimize system resources and maximize utilization in computer and communication networks. By analyzing the network relationships, data management graph analytics enables the identification content management of overburdened resources, and the result is relocation to save money, decrease risk and optimize operations.
For example, utility firms that supply essential services such as water, sewage, electricity, dams, and natural gas effectively employ knowledge graphs to optimize resource usage and to develop utility delivery systems that provide optimal performance while reducing the depletion of natural resources.
Logistics organizations also utilize graphs to optimize routes with graph analytics. Knowledge graph use enables the identification of the most optimal routes by analyzing all factors that influence travel and ultimately lowering costs and maintaining a smooth supply chain.