As a part of the digital transformation, organizations worldwide are investing heavily in changing data into knowledge and insight into action. Managers and leaders are focused on finding better ways to encode and use organizational knowledge throughout the decision making process. Enterprise knowledge graph benefit in better engaging and serving the workforce and the customers, thus improving the organization’s ability to stay competitive.
Data gathered and interpreted into knowledge is the most valuable instrument that an organization can own. However, knowledge is not just data placed into a database. It is a complex and dynamic material that unites each piece of information into a larger frame, creates a structure around it, reveals the interconnection, and ultimately incorporates it into the organization’s products, processes, and strategies.
When coupled with the data used to create the knowledge, experts, executives, and stakeholders acquire data agility: the ability to analyze data and quickly and easily make decisions based on interpreted information. Leaders use active, reusable enterprise knowledge placed in a power-concentrated graph to achieve a variety of strategic objectives.
Using knowledge graph to properly extract insights that align with the organization’s strategic goals is crucial for business sustainability. Developing the most appropriate context is the answer to any business-related queries and answer to questions. It is integral to all processes, including informed research, contextual applications, operations, grounded analytics, customer service, intelligence, complex manufacturing, compliance, supply chain, and more.
Table of Contents
The Origin of Knowledge Graph
In the 1980s, the University of Groningen and the University of Twente cooperatively began a project called Knowledge Graphs. The project’s main idea was to design semantic networks with edges restricted to a limited set of relations to facilitate algebras on the graph. And in 2012, Google introduced their Knowledge Graph: Introducing the Knowledge Graph: things, not strings, the knowledge graph that is widely used today.
The information age directs how organizations work, and information technology is necessary for conducting business. This, in turn, has led to an exponential increase in the electronic capture of data and its storage in vast data warehouses. In order to respond in accordance with the fast-changing markets, organizations must maximize the usage of raw data and information sources.
The process of digital transformation involves the analysis of data and information, but the crucial elements of digital transformation are the sophisticated tools that enable such analyses to occur. Knowledge discovery technologies facilitate data analysis to discover patterns and find relationships to achieve a profound impact on business strategies. The increased amount of data collected and the innovative applications are the competitive necessities for high-performance and intelligent application servers.
Knowledge management tools and technologies are the systems that integrate various systems, databases related content, and data warehouses to help the process of facilitating an organization or enterprise AI’s knowledge discovery. The crucial element is the integration of all elements with decision support within an online real-time event presentation.
All elements enable a synopsis of critical components enterprise ai, that empower key benefits of the organization to flourishingly manage knowledge sharing, knowledge distribution, knowledge creation, as well as knowledge capture and codification processes. In the long run, companies embrace knowledge management, organizational knowledge techniques, and information management capabilities.
What Is Knowledge Graph?
A knowledge graph, also called a semantic network, represents a network of real-world entities, such as objects, events, situations, and concepts within an organization, and illustrates the relationship between them. The information they represent is stored in a graph database and visualized as a graph structure, which prompts the term knowledge ‘graph.’
In the center of the knowledge graph is a knowledge model, a collection of interlinked descriptions of entities. The knowledge graph put data in context, connect them through linking and semantic metadata and provide a framework for data integration, unification, analysis, and sharing.
The three main components of knowledge graph are nodes, edges, and labels. Any object, client, agency, place, or person can be a node, while an edge defines the relationship between the nodes. This model is a powerful tool that has the ability to interpret the meaning of the keywords and provide relevant search results.
Knowledge graph is the ground-breaking method that revolutionized how organizations extract valuable and insightful information from the colossal amount of data generated, collected, and stored daily.
How Knowledge Graph Works
Knowledge graph generally comprises databases from various sources and typically differ in structure. The structure of diverse data is achieved with schemas, identities, and context work. Namely, schemas provide the framework for the knowledge graph, identities classify the underlying nodes, while the context determines the setting of the knowledge.
These components play a crucial role in distinguishing words with multiple meanings. For example, Google’s search engine algorithm is packed with the ability to determine the difference between “apple,” the fruit, and “Apple,” the brand.
Knowledge graph fueled by machine learning utilize NLP to construct a comprehensive presentation of the nodes, edges, and labels through a process called semantic enrichment. Whenever data is collected, this process enables the knowledge graph to identify objects and understand the relationship between those objects. The next step in the process is comparing the working knowledge to other datasets and integrating it into relevant and similar datasets.
After data warehouse for the knowledge graph is completed, users can utilize the search systems and get answers to their questions and additionally can retrieve and reuse comprehensive solutions to given queries. The data warehouse integration process within the knowledge graph is effective in the creation of new knowledge, establishing connections between separate data points that previously may not have been considered related.
Use Cases of Knowledge Graph
Numerous accredited knowledge graphs are mounting user expectations for search engines, and some of the widespread knowledge graph use cases include:
- Google knowledge graph represented by Google Search Engine Results Pages presents information based on what users search. This knowledge graph comprises over 500 million objects that source data from Freebase, Wikipedia, the CIA World Factbook, and more.
- Wikipedia.org consists of two graphs: DBPedia, composed of data from infoboxes, and Wikidata, focused on secondary and tertiary objects.
However, knowledge graph have broad applications in other industries, such as:
Healthcare
Knowledge graph benefit the healthcare industry by organizing and categorizing relationships between medical research and drug discovery. Knowledge graph validate the diagnosis, identify treatment plans, connect and unify clinical data, scientific research, and real-world data to accelerate drug discovery and provide efficient medical care for patients.
Finance
There are many variations in which knowledge graph assist in the finance industry, and the most common are the know-your-customer and anti-money laundering initiatives. This sector benefits from knowledge graph solutions’ power through financial crime prevention and investigation, and banking and government institutions efficiently understand money flow and identify non-compliant individuals.
Retail
Up-sell and cross-sell strategies rely on knowledge graph by recommending products based on purchases, behavior history, popular trends, and more among different focus groups of clients and consumers.
Entertainment
AI recommendation engines utilize artificial intelligence and the potential of knowledge graph and platforms such as social media, Netflix, and SEO. These content platforms analyze the online engagement behavior of the customers and recommend and serve new content to users.
What Is Enterprise Knowledge Graph?
An enterprise knowledge graph (EKG) is a metadata-centric platform that organizes siloed information into organizational knowledge and puts the information in context to make smarter decisions, accelerate innovation, and enable secure data sharing. The process involves consolidating, standardizing, and reconciling data efficiently and effectively.
Over the last decade, enterprise knowledge graphs have been on the rise, and the reason for that is because they are a precious tool for understanding, relating structured and unstructured data and thus discovering facts about understanding the organization. Additionally, understanding these knowledge graphs are the prerequisite for achieving Artificial Intelligence (AI) applications and finding hidden facts from the data, content, and organization knowledge, which otherwise would go unnoticed.
Semantic AI application, combined with Natural Language Processing (NLP) or recommendation engines, leverages the EKG to extract, relate, and deliver insights or answers to important business questions and make recommendations and suggestions. An EKG represents an organization’s knowledge gathered and stored on a domain, understood by both humans and machines and applied to the specific industry or organization.
Enterprise Knowledge Graphs: Use Cases
In addition to the use cases key benefits of knowledge graphs, as mentioned earlier, EKG is a high-octane tool for deriving valuable insights from enterprise data. The key focus areas where organizations are solving their most complex business challenges are:
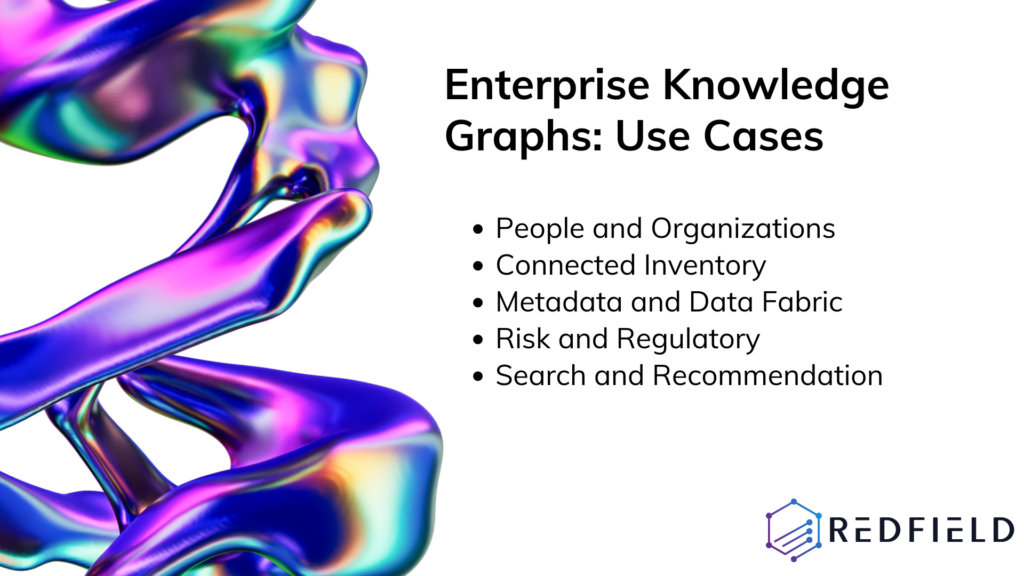
People and Organizations
One of the central use cases of enterprise knowledge graph is managing the complex relationships between people, companies, and legal obligations. The graphs serve to connect the information about organizations and individuals with a sense of context and precision, enabling forward-thinking companies to take advantage of managing and preserving the nature of business relationships while resolving issues and analyzing patterns.
The business world is not static, meaning the roles, structures, and relationships change frequently. The relationships in organizations are interconnecting, and unraveling and verifying them requires time and resources and is subjected to error. The graphs present all relationships to spot fraudulent patterns while avoiding duplication and misaligning customer records from different sources.
Connected Inventory
Organizations with massive inventory require effective management of operational capabilities, people and applications, data assets, technology structure, and more. An effective EKG system is the key to running a successful business. Namely, graphs help control operational resilience, operational risk, and cost management and provide transparency on interrelations between components.
The complexity of information sourced from many repositories contains different types of assets, data and information management keeping track of them and revealing the hidden connections is challenging. The integrated view enables companies to discover patterns, understand cost and profits, and full-scope organizational assets.
Metadata and Data Fabric
Data integration from multiple sources and linking of disparate repositories into a unified graph is a prerequisite for building a robust and controlled organizational environment. The process is often accompanied by conflicting names, structures, and definitions and additionally is also time-consuming and high-cost. EKG enable full access to data understandable to humans and machines.
Knowledge graph aligns multiple identities, names, definitions, and meanings into a data catalog or data API. The inability to unify data limits productivity and the organization’s agility, which is why EKG facilitates multiple viewpoints of data.
Risk and Regulatory
Organizations are obligated to follow policies, procedures, and legal requirements to facilitate regulatory reporting across multiple jurisdictions, lines of business, and products. Regulatory data aims to generate efficient regulatory reporting, protect data privacy and conduct a systemic risk analysis.
Enterprise knowledge graph align the business goal and regulatory data at a granular level. Additionally, graphs help financial and government institutions untangle the nuanced obligations between financial products, legal entities, and transactions. Graphs store information on policies, legal and reporting requirements for financial regulation purposes.
Search and Recommendation
Users can search the EKG to access relevant information and discover the right data and time, reducing the effort and revealing obstructed insights. For example, smart search, chatbot, and news are some features that enable users to extract value from various data sources.
The vast amount of data created daily is either unstructured or semi-structured, and the challenge is to create a contextually aware data environment that allows more intelligent search and recommender engines. Graphs make the data machine-readable; thus, valuable information about customers, products, or markets is connected and uncovers contextual insights.
For a real-world example, you can check the video below and learn how building an enterprise knowledge graph works:
Entity Reconciliation API
Matching entities across data sources using different identifiers and formats is a prevalent and unbidden issue on the web.
Entity reconciliation Application Programming Interface (API) is a lightweight, semantic clustering and deduplication service for tabular data. This AI-powered, self-standing API encompasses the Google core entity resolution engine. It helps data providers reconcile and join their data with multiple third-party datasets.
Some of the key features are:
- A first-rate quality pre-trained model with Google data
- Integrated entity enrichment, including geocoding
- Google-scale clustering and reconciliation can handle a graph consisting of billions of nodes and trillions of edges
- Unique identifier for each entity cluster (Stable Machine ID – MID)
- Capacity to support up to 10 BigQuery tables
How Does API Work?
While in relation databases, the matching is accomplished through managed keys (such as customer IDs), in graphs, the matching occurs through the combination of text, relationships, entity types, and attributes. This feature is effective in joining data across a diverse mix of systems.
The Entity Reconciliation API has the ability to read data from source BigQuery tables given a set of entity types and files mapped to a standard schema. Then, the API performs knowledge extraction to convert the input relation data into RDF triples like a knowledge graph representation.
The next step the Google Entity Reconciliation engine takes is to build a graph to cluster entities into different groups since the entities in the same group are considered matched. The final step is to output the linking result to the BigQuery tables in the form of a new unique identifier column (MID).
Conclusion
Why enterprise knowledge graph: because being data-driven is not enough, and by utilizing them, knowledge-driven organizations can act with full context and full confidence in their decision making process.
Real-world knowledge is situational, layered, and constantly changing, and these features represent the context that data is often missing. Knowledge graph turn data into machine-understandable knowledge and context to make smarter decisions, accelerate innovation, and enable secure data sharing. Additionally, enterprise knowledge graph is purpose-built tool for digital operations to store and analyze data and extract valuable information and new definitions.
FAQs
What Is Knowledge Graph?
A knowledge graph, also called a semantic network, represents a network of real-world entities, such as objects, events, situations, and concepts within an organization, and illustrates the meaning of these entities and the relationship between them.
How Knowledge Graph Work?
Knowledge graph generally comprises databases from various sources and typically differ in structure. The structure of diverse data is achieved with schemas, identities, and context work. Namely, schemas provide the framework for the knowledge graph, identities classify the underlying nodes, while the context determines the setting of the knowledge.
What Is Enterprise Knowledge Graph?
An enterprise knowledge graph is a metadata-centric platform that organizes siloed information into organizational knowledge and puts the information in context to make smarter decisions, accelerate innovation, and enable secure data sharing. The process involves consolidating, standardizing, and reconciling data efficiently and effectively.
What Are Enterprise Knowledge Graph Use Cases?
EKG use cases:
People and organizations
Connected Inventory
Metadata and data fabric
Risk and regulatory
Search and recommendation
What Is Entity Reconciliation API?
Entity reconciliation Application Programming Interface (API) is a lightweight, semantic clustering and deduplication service for tabular data. This AI-powered, self-standing API encompasses the Google core entity resolution engine. It helps data providers reconcile and join their data with multiple third-party datasets.