- Customer Service KPIs
- Types of Qualitative Data to Analyze
- How AI can Help in Customer Service Analytics
- What is Multi-label Classification?
- Multi-class Classification vs Multi-label Classification
- Using Multi-label Classification to Perform Customer Service Analytics
- What Is Our Solution Using KNIME?
- Efficient Customer Services with Automated Processes
32% of all customers would stop doing business with a brand they loved after one bad experience” says a PWC Report. Whether that was an issue caused by poor service, suboptimal product quality, or delays in delivery, gaining insight from customer service analytics can be a key driver for business growth.
Customer service analytics is the process of collecting, processing and analyzing clients’ feedback. The aim is usually to understand the data and create a plan for improving the customer experience.

In this article, we are going to use AI to improve a bank’s complaints management system. The aim is to improve the customers’ experience of how their complaint is managed by significantly reducing the time it takes to get each issue solved. Our ML model will be trained to analyze different types of bank customer feedback, sort the feedback into different categories and assign support tickets automatically.
So let’s dive in with an overview of typical customer service KPIs and the types of data we can analyze. Then we’ll show how multi-label classification and NLP can be used to improve customer experience.
Collecting customer feedback to perform your customer service analytics could happen on multiple touchpoints with clients: from customer support tickets and chats, through to email support, social media for reviews, comments, and chats. Gathering data from multiple channels and datasets is ideal. The more data for your analysis, the better the overview of your customers’ experiences, their opinions, struggles, and expectations.
But: The growing amount of data nowadays can be both inspiring and overwhelming. As data grows the opportunities and challenges for companies grow exponentially.
Customer Service KPIs
In order to track customer service and satisfaction, successful companies are setting KPIs. The KPIs usually go around the company-specific goals evaluating efficiency and success scores. Shortly, Customer Service KPIs determine how well Customer Service Teams are performing. We are not aiming to have an exclusive list on all the possible KPIs you can set for your customer service team but most companies are tracking some of most of the following: Number of Support Tickets & Complaints, Customer Satisfaction Score, First Contact Resolution (FCR), Net Promoter Score, Average Resolution Time.
Types of Qualitative Data to Analyze
Most of these KPIs are quantitative operational metrics. Setting up these metrics and analyzing them is critical. However, it’s also important to include qualitative data, like the content of reviews or customer support tickets, open-ended responses in surveys in your customer service analytics. AI (Artificial Intelligence) tools like KNIME can help sort this type of qualitative data to help the companies further understand and analyze their customer support service.
- Customer Support Tickets
The customer support ticket system is a must for every fast-developing company that wants to provide fast, easy and omnichannel help for their customers. Customer support tickets could be logged in via email, chat, in-app messaging and more. Usually having such a support system in place would mean your company is dealing with a large volume of tickets. And large volumes could be both challenging to manage but full of insides and valuable information.
- Customer Feedback
Customer feedback also could be provided by multiple channels. It could come in the form of social media reviews, complaints or surveys. In this type of content you will hear the customers’ voice, their opinion and what they think of your service or product.
Both customer support tickets and customer feedback are unstructured data. This means that, in order to make this type of data useful, first the data needs to be categorized or classified in a certain way. This type of classification or categorization could be solved with AI tools and algorithms. Using AI, makes the process of analyzing large volumes of qualitative data time-saving, accurate and more importantly scalable.
How AI can Help in Customer Service Analytics
In all the qualitative data examples so far we have mentioned the AI approach to managing it. AI stands for artificial intelligence and simply explained it is teaching machines to simulate human intelligence. Having this said, the main goal of using AI in the process of customer service analysis is to “read” our unstructured data and help us analyze it and learn from it.
By using machine learning and NLP (natural language processing), which are both part of AI, algorithms can be trained in order to “read” and “understand” the data just like humans do. Those algorithms learn from previously trained data and could be used for huge amounts of unstructured data.
If you have collected data from your customers’ support tickets and want to analyze the content of those tickets, you would have to go through hundreds of thousands of tickets manually and read and classify them in order to understand them further. Hopefully, nowadays no one is manually doing this unless you have a few tickets per day. If you have a case with large volumes of data, the manual approach could be time-consuming, expensive and inaccurate.
This is where machine learning comes into play. Within seconds the algorithms can automatically extract and classify large volumes of unstructured data. There are different cases where machine learning could be applied. For example, algorithms could be trained to identify the topic of a ticket and refer it to the most relevant team to solve the problem. Algorithms can detect urgency in the text so they can automatically prioritize the tickets.
What is Multi-label Classification?
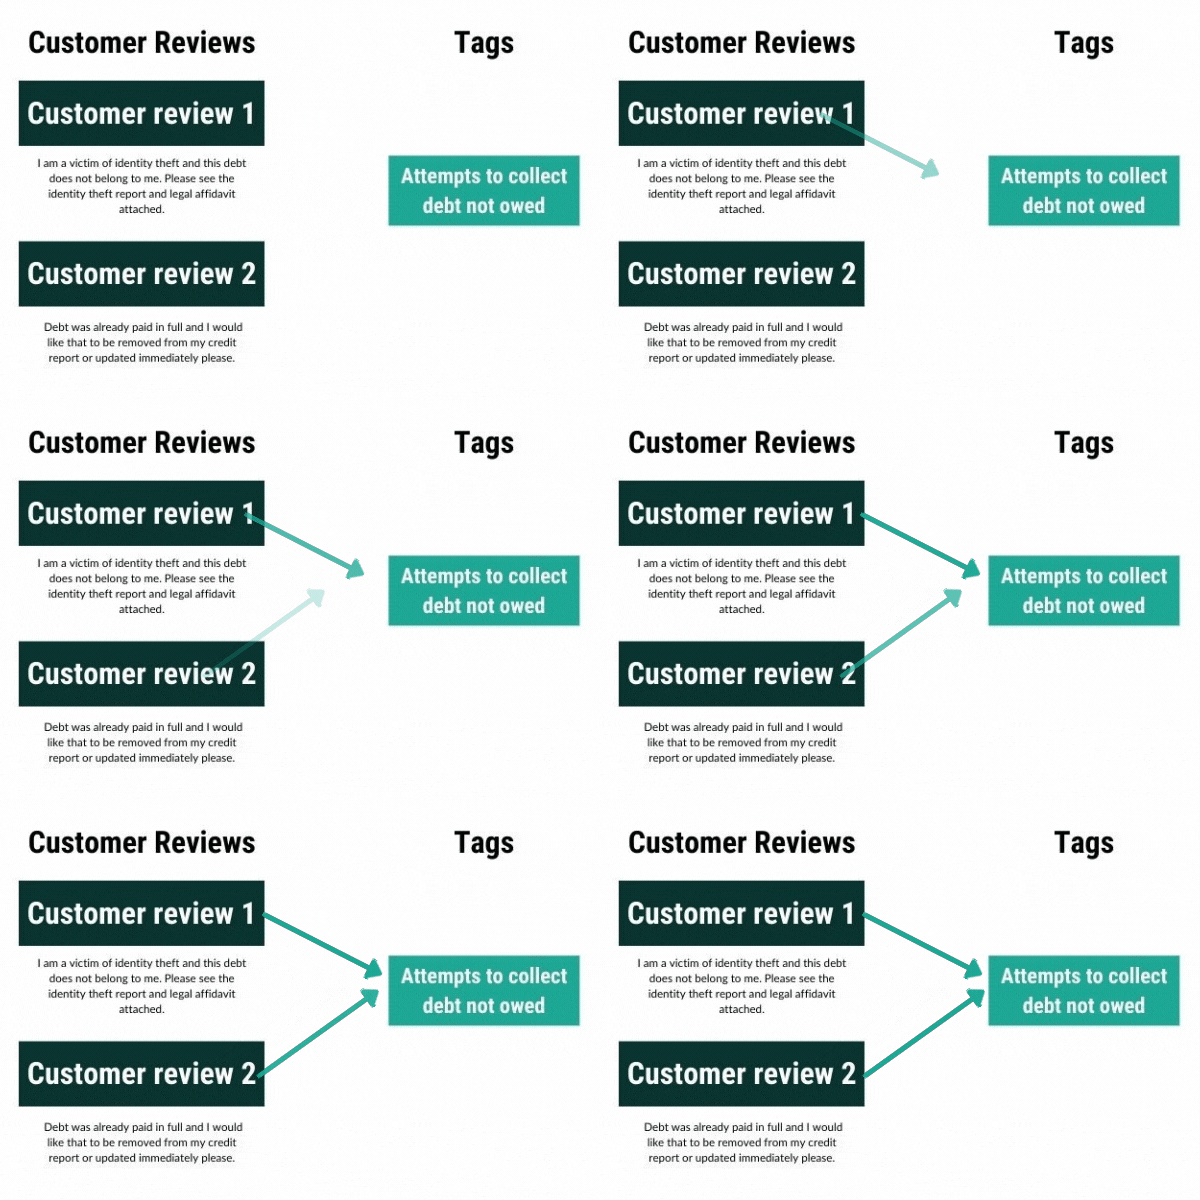
Multi-label classification is the process of investigating data samples, for example, text, and categorizing it into predefined multiple labels. One and the same data samples might be assigned to multiple labels at the same time, and the number of labels is usually arbitrary. Having this said, we need to mention that multi-label classification is a more general and more complex case for classification.
Today we will be looking at a customer service analytics case of customer feedback in a bank and we will solve it with another machine learning approach — multi-label classification.

Quantitative data analysis could be the next step to further understanding the reason behind your qualitative data. For example, your CSS (Customer Satisfaction Score) could be showing a drop in the recent month. Graphs can show you the drop but they can not explain it. Then the next step would be to understand what is behind the drop. And this is when the quantitative data comes in help. Qualitative data could come in many different forms but we will focus on the main two:
Customer service analytics cases with the need of multi-label classification range from classifying emails to identifying topics and urgency in customer tickets. Outside of customer service examples go along with the classification of different films and songs by their genres, assigning several topics or types of documents, assigning different types of customer complaints.
The main goal of multi-label classification is to predict the label sets. Commonly, the process is executed by assigning a data set with predefined labels. The task is to predict the label sets of unseen instances through analyzing training instances with known label sets.

Now let’s take a closer look at an example of a business case we trained.
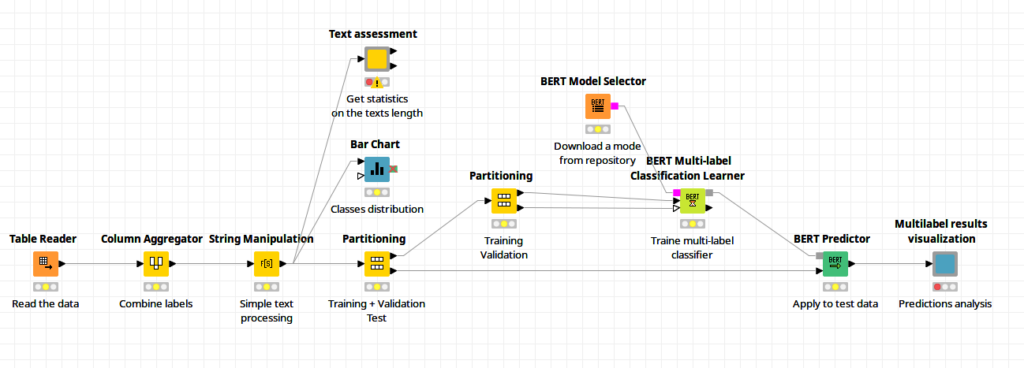
We are going to train a model that distinguishes different types of bank customers’ complaints (see the workflow). We have the texts of the complaints and the labels that need to go in place for each complaint. We will be aiming to label those texts automatically in order to identify what the text of each complaint is about.
But before we jump into how you can do that let’s see how multi-label classification differs from multi-class classification.
Multi-class Classification vs Multi-label Classification
The main difference from the multi-class classification is that the latter case considers classes to be mutually exclusive, while multi-label classification assumes that samples might belong to multiple classes at the same time, even more, the number of these classes is not fixed.
Using Multi-label Classification to Perform Customer Service Analytics
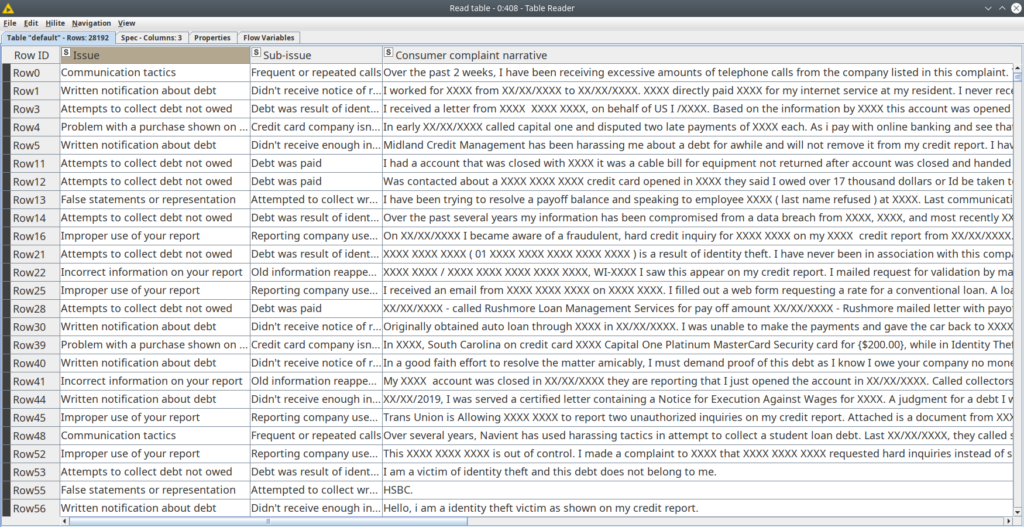
We will be looking at a particular business case where a bank has collected 28192 customer complaints and the managers want to further analyze the complaints. Some complaints might be a case for immediate actions, some could be a case for customer support tickets.
In our case, the 28192 customer complaints need to be labeled in order for the management to further react to it and take some actions. For example, if a certain complaint is labeled as an online banking issue, it is automatically sent to the online banking department. Then nexts steps occur. In our business case we will be tagging these 28192 complaints with 23 unique labels with a combination of 14 multi-labels.
But before we jump into the solution a clarification needs to be given about our data set:
The data set contains raw texts of the complaints, some data is classified (dates, account number, card numbers, etc), and the labels. Each label contains two entities, so we have some kind of a very simple ontology: a general issue and a specific one. Labels are presented as a pair of columns “Issue” and “Sub-issue”. The data is based on the data set from Kaggle.

What Is Our Solution Using KNIME?
We are going to use Redfield NLP Nodes to solve the problem of automatic assignment of the types of customers complaints so then the complaint segregation can be done automatically only based on the customer’s feedback.
- First, we need to take the data set we are going to use for training and model estimation and clean it a little bit — we need to get rid of the “XXXX” — like words that are used for masking personal data.
- Next, we need to make sure that the complaint text contains at least 20 words, so it is meaningful.
- And finally, we can sample the training, validation and test data sets.
- The next step is to construct the model. To do so, we need to pick a trained BERT model from one of the famous repositories — TensorFlow Hub or Hugging Face, then feed it to BERT Multi-label Classification Learner. This node will automatically build a much smaller neural network on top of the select BERT model, and the combined model is ready for training. Just feed in training and validation sets to the Learner node, set up the training parameters and train the model. Once the training is over, we can estimate its predictive power. Just apply the model on the test data set and calculate the metrics for Precision, Recall and F-measures. We managed to get about 83% for F1 measure — quite a good result for the case that has many classes to distinguish.
Scale the Process with KNIME Server
This task can also be easily scaled using KNIME Server for the training process, where you might need a powerful GPU. Then you can process thousands of texts and get the dashboards with the prediction analysis similar to what we have built in our demo. Another use case for KNIME Server is building a microservice where the text can be sent via REST API, then you can immediately get the prediction, and then, based on it, you can start another process like creating a ticket, responding to a customer by email or sending the complaint to the manager. In the latter case, you do not even need a powerful GPU-instance once your model is trained and ready for production usage.
Efficient Customer Services with Automated Processes
Applying the model from this particular case will help you automatically assign the types of complaints from the customer only based on the text. This customer service analytics solution could be even more efficient than manual complaint type assignment by the customer since they can not accurately identify the label for their complaint. This can save you a lot of time in identifying the topic of the complaint. Labeling automatically will help you to react to the complaints faster. Moreover, it might be more convenient for the customers as this way they should only describe the problem without looking for appropriate tags to label it. Obviously, it is a win-win-win solution.
The used BERT-based model which we introduced is the current state-of-the-art approach for many NLP tasks. At the same time, there is no need to code Python at all since we already managed this for you. The only thing you are expected to do is just do some settings in a user-friendly nodes dialog in KNIME.
