Uncovering actionable insights from data is a critical process in the maintenance of modern businesses, keeping track of trends and customer requirements, achieving success, and gaining a competitive advantage. As data volume, velocity, and variety have expanded, it has become increasingly challenging for traditional data analysis tools to complete even the most basic analysis. This is where software like Alteryx comes into play. In this blog, we will discuss what is Alteryx, how it works, and what it is used for.
Tools and processes, overburdened by the big data, can be complex to use, resource-intensive, and time consuming, often requiring multiple steps by data scientists, data analysts, data engineers, and other data workers. Over the last decade, data volume and diversity have expanded and evolved at an unprecedented pace, which is why IT organizations are feeling pressured to provide the business tools necessary for swift and prompt data analytics. This has resulted in data workers creating intuitive and self-service software solutions that have the power to bypass IT and perform data analytics themselves.
Moreover, traditional tools and manual processes are more and more commonly untrained to keep pace with the sophistication and speed of analytics that organizations demand. These tools lack the finesse of producing percipient information fast but also need more scalability and the ease of use that business analysts need to transform the massive amounts of available data into intelligent and actionable insights.
Alteryx is a software platform that enables organizations to significantly improve business outcomes and increase the productivity of business analysts. We analyzed Alteryx’s business model, but before diving into what Alteryx is, we will briefly explain what data science is, data analytics, what data scientists do, and how they analyze data. We will present data processes, including data preparation and analytics software alternatives to Alteryx.
Table of Contents
What Is Data Science?
Data science is the study of data with the goal of extracting meaningful insights for companies that are valuable and relevant for business decision processes and strategic planning. This multidisciplinary approach of analytics solutions combines principles and practices from several fields, including math, statistics, artificial intelligence (AI), machine learning, and computer engineering, to analyze the collected data and uncover actionable information hidden in an organization’s data.
Companies handle large amounts of data collected from various data sources. The accelerating volume of data has made data science one of the fastest-growing fields dominating every industry. Companies are increasingly reliant on information extracted from data analytics. Scientists interpret data and provide recommendations and suggestions to improve business outcomes. Namely, with data analytics, scientists ask and answer essential questions: “What happened? Why it happened? What will happen as a result of certain action? What can be done with available resources?” and many more critical to corporates worldwide.
What Is Data Science Lifecycle?
The data science lifecycle involves a variety of roles, tools, and processes that enable data analysts to obtain actionable insights. Typically, the lifecycle management a data science project involves the following stages:
Data ingestion – data collection
The lifecycle of data science begins with data collection. This process involves the collection of raw structured and unstructured data from different relevant sources using various methods. The most common methods for data collection are manual entry, web scraping, and real-time data streaming from systems and devices. Data sources for structured data include customer data. The most common sources for unstructured data are log files, video, audio, pictures, the Internet of Things (IoT), social media, and more.
Data Storage and Data Processing
Data is collected in different formats and has diverse structures, meaning organizations must consider different storage systems based on the type of data they need and, consequently, the data that will be collected. Data management teams work on setting the standards related to data storage and data structure, which furthermore clears the way for workflows around analytics, machine learning, and deep learning models. In the stage of data storage, processes such as cleaning data, deduplicating, transforming, and combining the data using ETL (extract, transform, load) jobs or other data integration technologies are also included. These data preparation processes ensure and promote data quality before loading the data into a data warehouse, data lake, or another repository.
Data Analysis
Data scientists conduct an exploratory analysis of data to discover biases, patterns, ranges, and distributions of values within the data and thus improve business outcomes. With the analysis explorations, scientists gather hypotheses for testing purposes. Additionally, data analysis allows experts to determine the relevance of data within the modeling efforts for predictive analytics, machine learning, and deep learning techniques. Depending on the model’s accuracy, companies become reliant on the gathered insights and base their decisions while ensuring the scalability of the process.
Communicate
The final step of the data science project is a report or series of reports and data visualizations that present the obtained information and insights from data. Moreover, with the analysis of these reports, companies can understand their impact on businesses. Furthermore, with data science programming languages, such as R or Python, scientists can include data visualization components and create dedicated visualization tools.
Data Science Versus Data Scientist
Data science is the discipline, and scientists are the practitioners within the field. Scientists ask the relevant questions and identify business deficiencies, flaws, and fragilities, for which the data analysis is performed in the first place. In addition to asking crucial questions from business acumen, scientists apply statistics and computer science to analysis of data. By using a wide range of tools and techniques for data preparation and extraction, scientists are in charge of databases, data mining, and data integration methods.
With the help of predictive analytics and artificial intelligence, scientists extract insights from big data, often including machine learning models, natural language processing, and deep learning. After the data processing and calculations are finished, scientists illustrate and present the results in a manner that clearly conveys the meaning of the results to managers and stakeholders at all levels to help the decision-making processes.
The responsibilities of data scientists often overlap with other experts in the field of data analytics. In other words, scientists are not necessarily directly responsible for all processes involved in the data science lifecycle. For example, data engineers are in charge of data pipelines, but scientists can make recommendations about what type of data is valid or required. Another example is that scientists can build and explore machine learning models. Still, extended knowledge and software engineering skills are necessary for scalability to optimize the program to run smoothly. Last but not least, scientists collaborate with other data science team members, such as data and business analysts, IT architects, data engineers, and application developers.
Data Science Versus Business Intelligence
Data science and business intelligence (BI) are terms that come hand-in-hand when discussing the analysis of data. Both terms relate to an organization’s data and analysis of that data, but they differ in focus.
Business intelligence (BI) is an umbrella term commonly used for the machinery that enables data preparation, data mining, data management, and visualization for business functions. Business intelligence processes and tools allow users to identify actionable information from raw data and thus help the decision-making process with data-driven insights across various industries.
Not so rarely, it might be confusing. Since the data science solutions and tools overlap in this regard, business intelligence is focused on historical data (data from the past), and BI tools’ insights are more descriptive in nature. Put simply, BI uses data to understand what happened before with the aim of informing a course of action. BI data is intended to be used for a particular purpose and is focused on static data that, in most cases, is structured. On the other hand, data science uses descriptive data to determine predictive variables and categorize data to make forecasts.
Speaking about being mutually exclusive, data science and business intelligence, digitally savvy companies use both to deeply understand data and extract value from the information contained in the data.
Now that we have briefly explained the basic terms related to data and analysis of data, we will make an overview of what Alteryx is and how this business intelligence tool is making data preparation and analysis more efficient.
What Is Alteryx?
Alteryx is a tool that is gaining popularity and is in the realm of business intelligence. This platform enables companies to swiftly and effectively solve business issues and is complementary to the existing BI tech stack. While it can be a vital component of a digital transformation process or automation project, this platform does have its disadvantages.
Alteryx enables users to create business intelligence processes that are effective, repeatable, error-free, and risk-free. One of the best features of this tool is that Alteryx is simple to use, making it a great choice even for teams who lack an IT background or coding knowledge. Consequently, businesses that choose Alteryx over other tools available on the market enjoy greater employee engagement and bandwidth from data analysts in different areas.
Definition: Alteryx is a software program that allows users to access, alter, analyze, and export data for business intelligence purposes. This tool enables teams to do this on a one-time basis or repeatedly, either daily, weekly, or monthly. Alteryx allows users to create workflows for different purposes, which can later become part of process documentation and enable teams to examine them, contribute to changes, and suggest workflow improvements.
Nevertheless, we can analyze the definition of Alteryx from business and technical aspects.
Business definition: Alteryx is a software platform that enables users to work with data in a straightforward manner. With the Alteryx software, the processes for data access, data cleansing, data testing, combining, analysis, and data outputting are simpler and more accessible than with similar tools such as Excel, SQL, or Power Query.
These processes are performed in numerous departments that require data manipulation, consolidation, testing, or analysis. A few examples across departments include:
- Finance for forecasting events and combining data from various departments.
- Audit to test large data sets, search the data for anomalies/fraud, and continuous audits.
- Accounting for reconciliations and consolidations.
- Tax for analysis, apportionment, state/federal filings, etc.
- HR for predicting attrition, wage adjustments, and powering executive dashboards.
- Marketing for combining data from myriad online platforms and A/B testing.
- SalesOps for commission reporting and territory planning.
- Supply Chain/Procurement for analysis of vendors, cost, and timing.
- IT for prompt responses to queries, reducing the burden of SQL, and populating databases and BI tools.
Technical definition: Alteryx is a software solution that enables users to speedily access, manipulate, and analyze data and generate data outputs. This can be done in a one-off manner, or more commonly (a process called workflow) according to the organization’s needs (daily, weekly, and monthly basis). Data can be read and written to files, databases, and APIs and enable users to analyze the data, collaborate during the process, and enhance the overall process within the organization.
The video below offers brief explanation about what is Alteryx:
About Alteryx
Alteryx is an American computer software company based in Irvine, California, with a development center in Broomfield, Colorado, and offices worldwide. It was founded in 1997.
As of April 2023, Alteryx offered the following products to its customers as part of an analytics platform:
- Alteryx Designer Cloud
- Alteryx Designer
- Alteryx Intelligence Suite
- Alteryx Machine Learning
- Alteryx Auto Insights
- Alteryx Location BI
- Alteryx Connect
- Alteryx Server
- Alteryx Cloud Execution for Desktop
- Alteryx Designer FIPS
- Alteryx Server FIPS
Alteryx comes packaged with an array of predictive analytics modeling tools, such as the Alteryx analytics cloud. It offers a slew of helpful visualization tools, making it flexible enough for many users, starting from scientists to employees with zero IT knowledge. Thanks to the features of Alteryx analytics cloud, any scientist or knowledgeable business user can perform sophisticated and advanced analytics in a relatively short time frame. However, due to its code-free facet, its design is user-friendly and suitable for less technical users without a deep understanding of data science and data modeling.
Workflows of the Alteryx software analytics platform are effortlessly stored as modules, making them reusable with other datasets. As a result, this platform offers the creation of customizable dashboards for non-technical users. For example, management teams can use simple interfaces to enter and modify data on the fly.
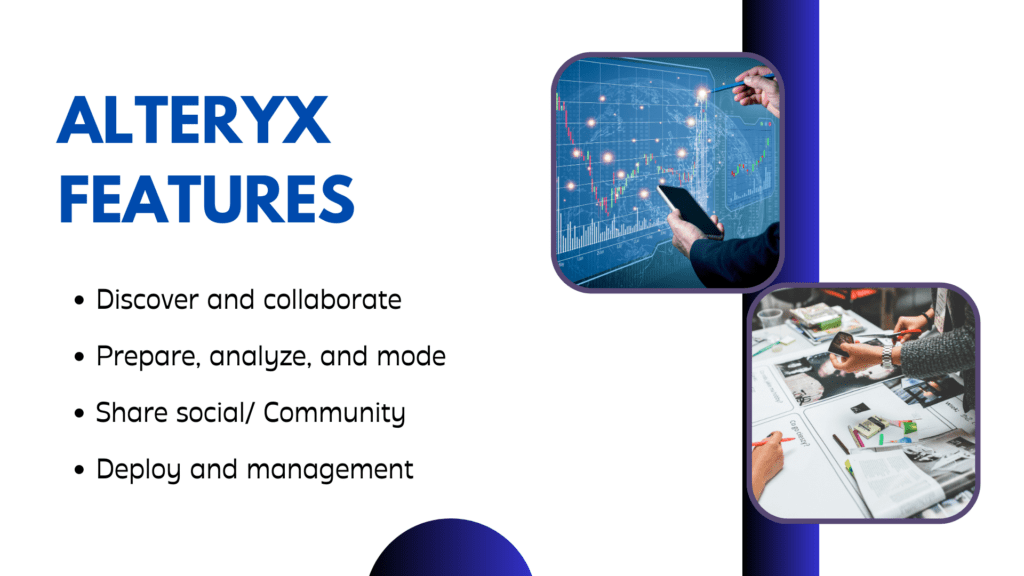
Alteryx Features
Alteryx’s features can be divided into four categories:
Discover and collaborate
Users can search through any data asset and can collaborate with other users while creating new analytics tools. Additionally, Alteryx enables users to access models other users have created to avoid boondoggle.
Prepare, analyze, and mode
With Alteryx, users can prepare the data and build data models that can be used and reused for similar data sets.
Share social/ community
Alteryx promotes sharing valuable information between users. The open-source movement ideas are successfully implemented into Alteryx’s software to encourage the sharing of information and analytics tools developed by users from the community.
Deploy and management
By using the existing R and Python models, Alteryx has the option to be deployed directly into production with no need for modifications. This feature enables business users to run streaming analytics without performing significant changes to workflows previously created in the test environments.
Alteryx Review
The Alteryx intuitive user interface is a simple canvas with a series of tools. The tools are organized and color-coded by category from a top menu. An icon or node represents the tools, and a drag-and-drop option exists for moving onto the canvas. Alteryx recognizes associations between nodes and connects them seamlessly, meaning the workflows are automatically created when the user places a new node next to an existing one.
Loading data
The first step in creating a workflow is to load a dataset. Alteryx solved this by simply dragging the “input data” tool onto the canvas, after which the user is immediately prompted to select the data source. The data sources include everything, from simple CSV files to various databases such as SQL Server, Oracle, and more, including Hadoop files and other ODBC databases, Teradata Bulk, OleDB, ESRI, etc.
Depending on the type of file loaded, the users are prompted to choose several parameters. Typically, the next step involves dragging a “browse” tool, enabling users to see the actual data loaded onto the canvas and recognize some basic patterns. For example, when the users select a column of the data, a graph displaying frequencies of values within the data is displayed. The software automatically recognizes various data types, such as dates, presented in the image below:
This is a simple example of connecting two tools: the “data input” and the “browse” tool.
Furthermore, Alteryx offers custom filter tools that are handy for specific departments, such as marketers. For example, if the market team is running a campaign targeting only the US and the dataset includes information about individuals outside the target market, the manager can select only the data for individuals within the US. The tool also creates a simple Boolean switch that enables the manager to switch between indicators as true and false. Additionally, users with IT backgrounds can create custom formulas and advanced filters.
Joining Data
It is not uncommon for users to have several different datasets, which, if combined, can provide more extensive information than analyzing a single file. For example, if one spreadsheet contains data about the location of the customers, and a separate spreadsheet includes a list of visits by customers to a store, a merged spreadsheet will provide valuable information about customer behavior. Users can easily create a parallel workflow and combine the spreadsheets using the “join” tool. The process is straightforward when spreadsheets share a common ID.
By applying other tools available in the Alteryx menu, the user can output the data into a .csv, database, tableau, or other formats for further analysis, or you can apply it directly to the next stage in your current visual workflow.
Predictive modeling tools
Organizations that work as direct marketers are focused on increasing the conversion rate, which can be achieved by data analysis and identifying factors and critical characteristics such as individuals and groups who have responded in the past. Suppose the company has a large enough dataset. In that case, predictive analysis can determine the groups most likely to react positively to a mailer and create a model that can be utilized for future campaigns.
Alteryx offers a large selection of predictive modeling tools created with R and Hadoop, a practical feature for data scientists. Moreover, since it is codeless by design, Alteryx’s drag-and-drop workflow interface makes these features accessible to users without an IT background.
Data visualization
Many consider Alteryx the leading tool in the industry due to its ability to visualize data. Users can combine a number of datasets and overlay the results to analyze and visualize the information in a spatial sense.
For example, if the user has data stored in spatial polygons, Alteryx offers a built-in “spatial process” tool to combine the datasets visually. Additionally, the “browse” tool can help users demonstrate how the data looks within a map overlay.
Report Design Features
Alteryx offers simple and easy-to-use tools for designing reports by dragging and dropping elements. Users can create basic text and draw out items for visualization in a dashboard.
Customizable User interfaces
Business users can customize interactive models, create tabs, change text, and add filters in order to change views of data on the fly. The example demonstrates simple tabs with filters for adjusting parameters.
Downloadable templates
Alteryx has a cooperative community that encourages users to share templates so that others do not need to repeat processes that have already been completed by someone else. This feature makes creating workflows significantly easier and saves time, even for advanced users. There are many downloadable templates shared within the Alteryx community that are valuable assets for direct marketers.
The example below shows a Customer Acquisition Model for channel-based marketing that combines multiple data streams and processes them into a standard format that can be exported as a Tableau file.
Should I Pick Alteryx Over Other Technologies?
In the text above, we analyzed the benefits of using Alteryx as an all-in-one business intelligence solution. While being worth looking into, this platform has its downsides, which should be considered when opting for a tool for the organization that connects data, processes, and people.
To investigate more choices and make the best decision possible, keep in mind the following disadvantages of using Alteryx:
- The platform’s syntax can be unclear when noting where code is required.
- Alteryx offers cloud-based data connections.
- The AMP Engine that Alteryx uses is not as reliable as some users would expect
- The two-week free trial might not be enough time for companies to explore and test the efficiency and compatibility of the platforms.
- Pricing can be a drawback for many organizations with tight budgets. The Designer Cloud pack purchased in the United States starts at $4,950, and the Designer Desktop prices start at $5,195. New customers need to pay a separate platform fee and a minimum purchase of 3 users in addition to the Designer Cloud price listed.
- The response time for extensive data sets can be extended.
Summary: Key takeaway and KNIME alternative
Alteryx offers a great set of features, and combined with simple use, this tool is an excellent choice as an ETL solution. The built-in predictive models for market analysis make it a common choice for mail marketers aiming for software that unleashes the existing markets’ secrets and identifies their strategies’ strengths and weaknesses.
Being user-friendly and easy to use, Alteryx is an excellent choice for beginners since the software enables the creation of modular workflows to extract, transform, and load data while providing tools for building interactive dashboards.
However, Alteryx is not a perfect system, which is why we offer you an alternative that might fulfill all expectations and demands from software: KNIME.
Why choose KNIME Software?
KNIME vs. Alteryx offers a complete platform for end-to-end data science. With KNIME consultancy, users can create analytic models, deploy them, and share insights within the organization through data apps and services. With the low-code/no-code interface, users can perform analysis at the highest level of sophistication, manage data with automated workflows, access and blend data from any source, and explore the data with interactive data views. Workflows can be shared with colleagues or broader organizations, and the data processes and modes can be saved and reused.
KNIME and Redfield could benefit any business in various spheres, including Finance and Financial Services, Media, Government, Healthcare, Engineering, and Telecommunications. With over 19 years of experience in advanced analytics and business intelligence and 4 years of successful partnership with KNIME, our dedicated team can help customers get started on projects efficiently.
FAQs
What Is Data Science?
Data science is the study of data with the goal of extracting meaningful insights for companies that are valuable and relevant for business decision processes and strategic planning.
What Is Alteryx?
Alteryx is a software program that allows users to access, alter, analyze, and export data for business intelligence purposes. This tool enables teams to do this on a one-time basis or repeatedly, either daily, weekly, or monthly. Alteryx allows users to create workflows for different purposes, which can later become part of process documentation and enable teams to examine them, contribute to changes, and suggest workflow improvements.
What are the Alteryx Features?
Alteryx’s features can be divided into four categories:
Discover and collaborate;
Prepare, analyze, and mode;
Share social/ community;
Deploy and management.
Why choose KNIME Software?
KNIME offers a complete platform for end-to-end data science. With KNIME, users can create analytic models, deploy them, and share insights within the organization through data apps and services. With the low-code/no-code interface, users can perform analysis at the highest level of sophistication, manage data with automated workflows, access and blend data from any source, and explore the data with interactive data views.